
Figures & data
Table 1. Cohort characteristics.
Figure 1. Neutrophil and platelet recovery between the two cohorts. Neutrophil recovery rates(A) and platelet recovery rates (B).
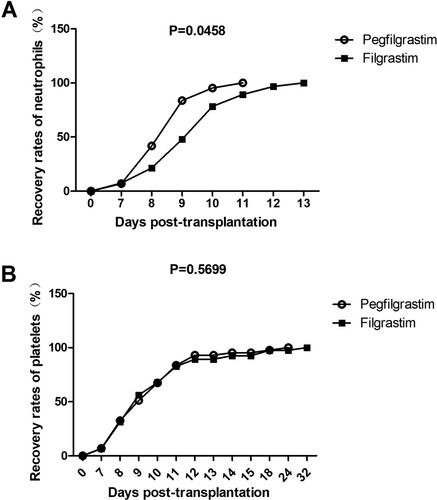
Figure 2. Causes of febrile neutropenia in the two cohorts.
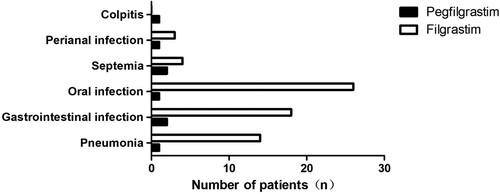
Table 2. Infections complications in two groups.
Figure 3. White blood cell counts on day 1 after injection of pegfilgrastim and duration of neutropenia in pegfilgrastim group patients with different primary diseases.White blood cell counts on the first day after injection of pegfilgrastim (A) and duration of neutropenia (B).
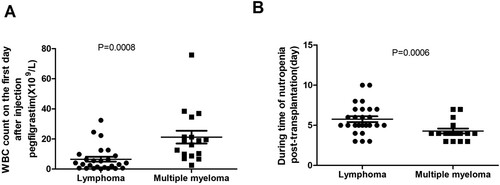
Table 3. Cost analysis in two groups.