
Figures & data
Table 1. Baseline patient characteristics.
Figure 1. Kaplan–Meier curves of survival for AML and MDS patients aged over 70 years. (A) OS for all patients; (B) DFS for patients who achieved CR after treatment. OS, overall survival; DFS, disease-free survival; CI, confidence interval; CR, complete remission; AML, acute myeloid leukemia; MDS, myelodysplastic syndrome.
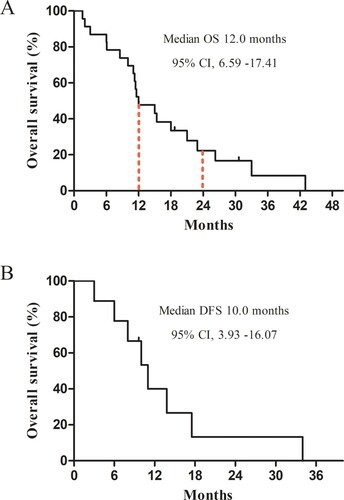
Figure 2. Kaplan–Meier curves of OS for AML and MDS patients aged over 70 years. (A) CCI subgroup in all patients; (B) WBC subgroup in all patients; (C) OS for patients who achieved CR and those none-CR. OS, overall survival; CCI, Charlson’s comorbidity index; WBC, white blood cell; AML, acute myeloid leukemia; MDS, myelodysplastic syndrome; CR, complete remission.
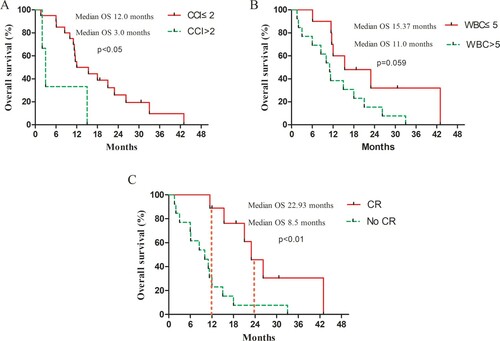
Table 2. Univariate analysis for overall survival.
Table 3. Multivariate analysis for overall survival.