Figures & data
Table 1 . Clinical characteristics.
Table 2. Uni- and multivariable Cox-regression.
Figure 1. Overall survival for all patients.
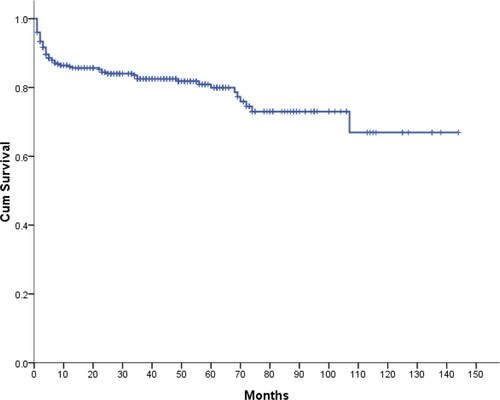
Figure 2. Overall survival in different age groups: ≤35 years, 36∼65 years, and ≥66 years.
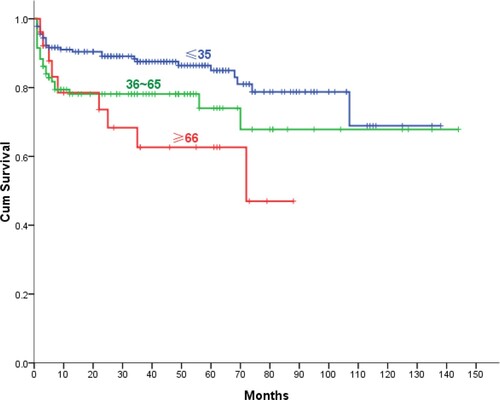
Figure 3. Overall survival according to disease severity at diagnosis (very severe, severe, and non-severe AA).
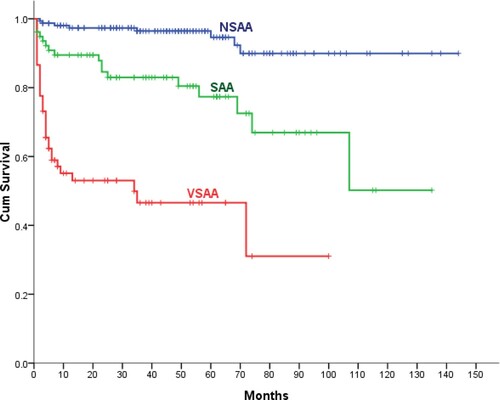
Figure 4. Overall survival for SAA/VSAA patients according to primary treatment.
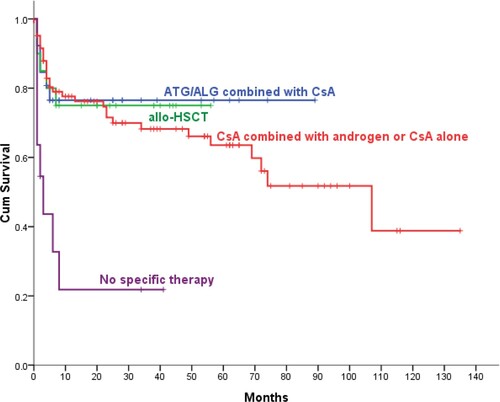
Figure 5. Correlation between duration of maintenance treatment and PFS in AA patients after response to primary therapy CsA.
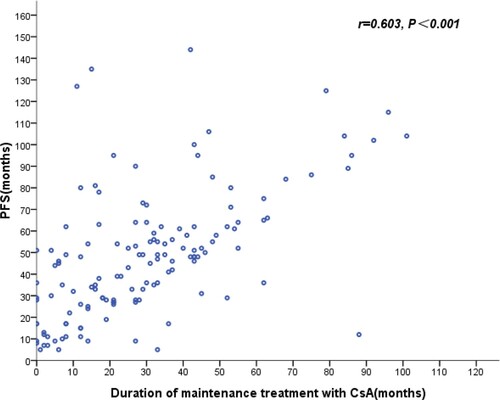
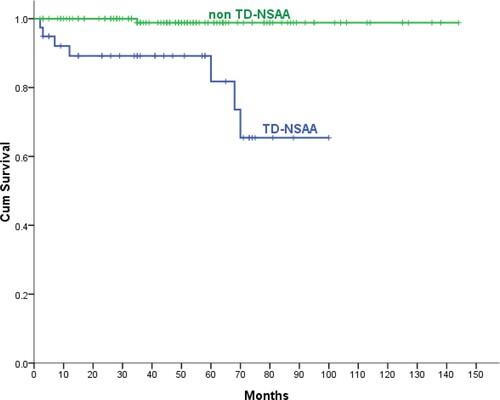
Figure 6. Overall survival for TD-NSAA and non–TD-NSAA patients.