Figures & data
Figure 1. Flow diagram of study selection.
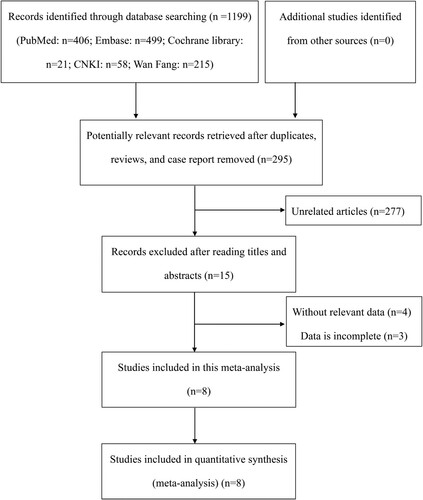
Table 1. Main characteristic of studies in the meta-analysis.
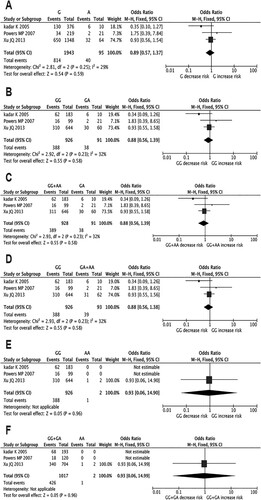
Figure 2. Forest plots of pooled ORs and 95% CI for evaluating the association between TNF-α G308A polymorphism and MDS susceptibility in six different genetic models: (A) allelic (G versus A), (B) heterozygous (GG versus GA), (C) over-dominant (GG + AA versus GA), (D) recessive (GG versus GA + AA), (E) homozygous (GG versus AA), (F) dominant (GG + GA versus AA).
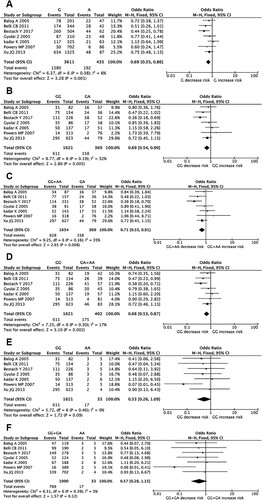
Figure 3. Forest plots of pooled ORs and 95% CI for evaluating the association between TNF-α G308A polymorphism and MDS susceptibility according to different ethnicities in four different genetic models: (A) allelic (G versus A), (B) heterozygous (GG versus GA), (C) over-dominant (GG + AA versus GA), (D) recessive (GG versus GA + AA).
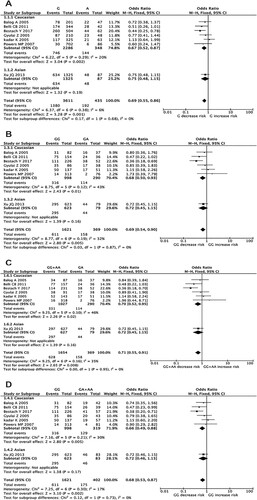
Figure 4. Forest plots of pooled ORs and 95% CI for evaluating the association between TNF-α G238A polymorphism and MDS susceptibility in six different genetic models: (A) allelic (G versus A), (B) heterozygous (GG versus GA), (C) over-dominant (GG + AA versus GA), (D) recessive (GG versus GA + AA), (E) homozygous (GG versus AA), (F) dominant (GG + GA versus AA).