Figures & data
Figure 1. Flow diagram of study selection.
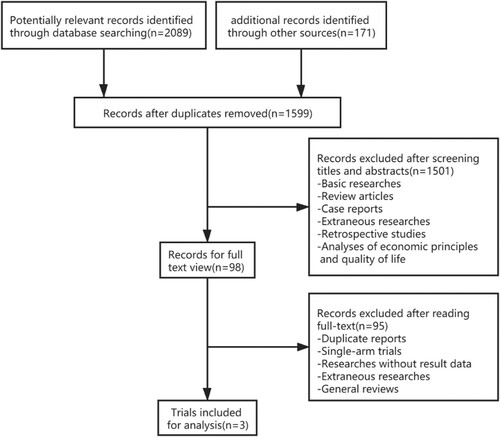
Table 1. Characteristics of studies included in the meta-analysis.
Figure 2. Risk of bias assessment of included studies. ‘+' low risk, ‘-' high risk, ‘?’ unclear risk.
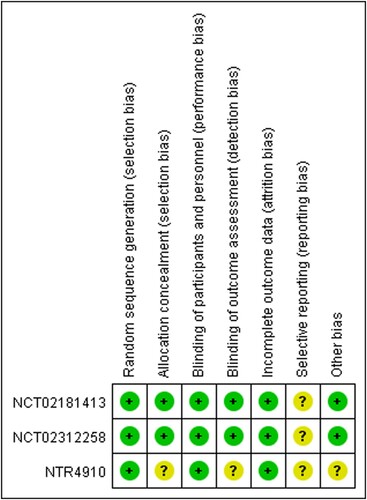
Figure 3. Pooled HR of PFS comparing ixazomib maintenance therapy with placebo.
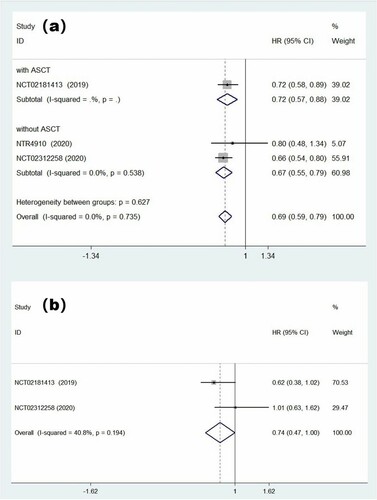
Figure 4. Pooled RR of deepening remission comparing ixazomib with placebo.
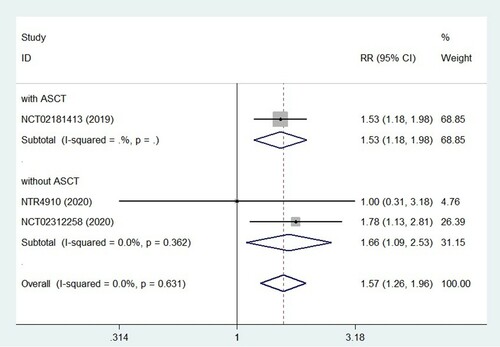
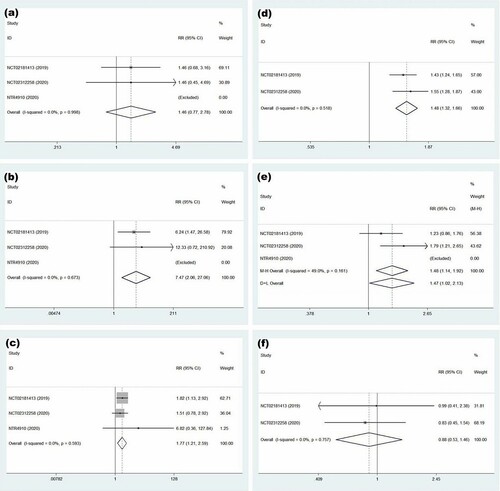
Figure 5. Forest plot of safety for treatment with ixazomib group versus placebo. (a) Forest plot of grade 3–4 neutropenia. (b) Forest plot of grade 3–4 thrombocytopenia. (c) Forest plot of grade 3–4 infections. (d) Forest plot of gastrointestinal disorders. (e) Forest plot of neuropathy. (f) Forest plot of the new primary malignant tumor.