
Figures & data
Figure 1. PRISMA flowchart for study selection. ASCO, American Society of Clinical Oncology; EHA, European Hematology Association; PRISMA, Preferred Reporting Items for Systematic Reviews and Meta-Analysis. *Four full text publications for included studies were identified manually at a later date, after the completion of the Ovid search, and were incorporated into the SLR results.
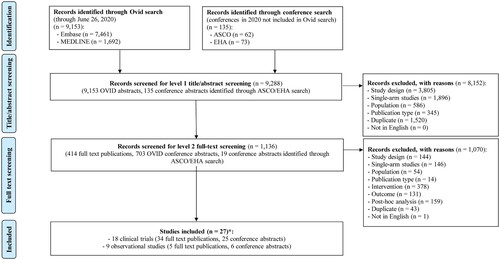
Figure 2. Network diagram for all studies included in the NMA. IMiD, immunomodulatory drugs; NMA, network meta-analysis; PI, proteasome inhibitor.
Notes: Studies listed in blue font are observational and those listed in black font are clinical trials. Gray connecting lines indicate links dependent on observational studies (i.e. these links and network branches dependent on them only appear in the extended network analyses and not in the base case analyses).
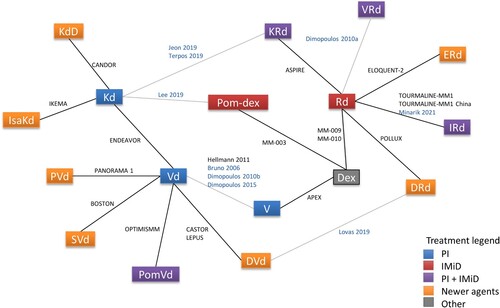
Figure 3. NMAs of PFS. CrI, credible interval; HR, hazard ratio; NMAs, network meta-analysis; PFS, progression-free survival.
Note: Bolded font indicates that the results are statistically significant.
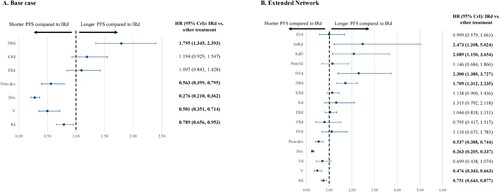
Figure 4. NMAs of PFS – subgroup analyses. CrI, credible interval; HR, hazard ratio; NMAs, network meta-analysis; PFS, progression-free survival.
Note: Bolded font indicates that the results are statistically significant.
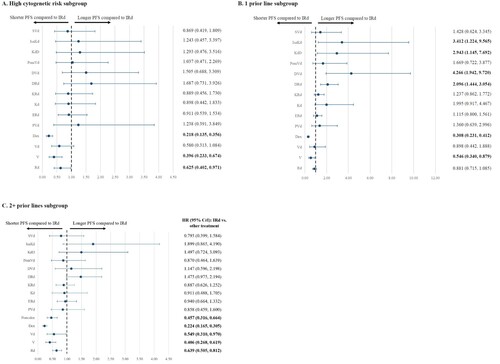
Figure 5. NMAs of OS. CrI, credible interval; HR, hazard ratio; NMAs, network meta-analysis; OS, overall survival.
Note: Bolded font indicates that the results are statistically significant.
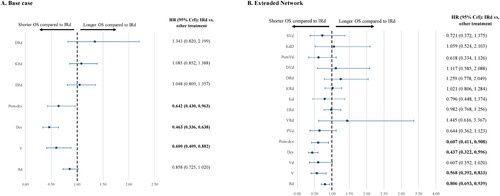
Figure 6. NMAs of OS (sensitivity analyses). CrI, credible interval; HR, hazard ratio; IPCW, inverse probability of censoring weighting; NMA, network meta-analysis; OS, overall survivial; RPSFTM, rank-preserving structural failure time models.
Note: Bolded font indicates that the results are statistically significant. IPCW- or RPSFTM-adjusted HR for OS from the TOURMALINE-MM1 trial was used in these sensitivity analyses.
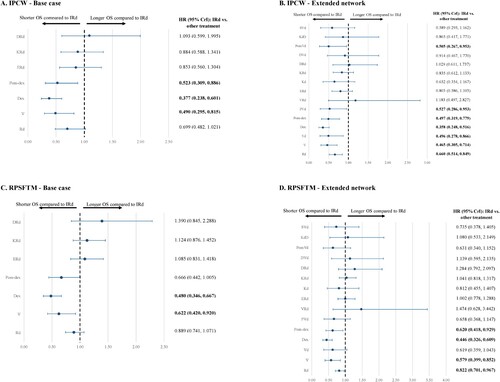
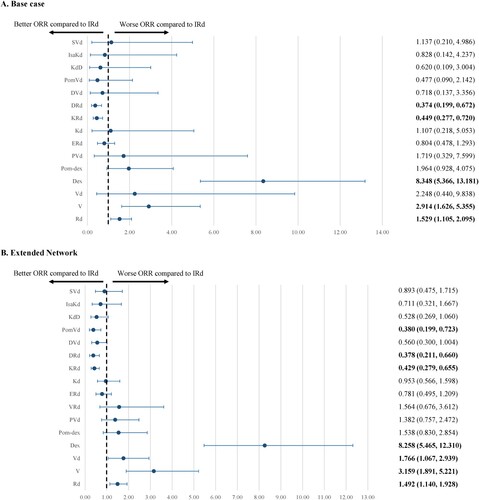
Figure 7. NMAs of ORR. CrI, credible interval; NMA, network meta-analysis; OR, odds ratio; ORR, overall response rate.
Note: Bolded font indicates that the results are statistically significant.
Supplemental Material
Download MS Word (437.1 KB)Data availability statement
Data analyzed in this study were a re-analysis of existing data, which are publicly available as cited in the reference section.