
Figures & data
Figure 1. The chip experiment process.
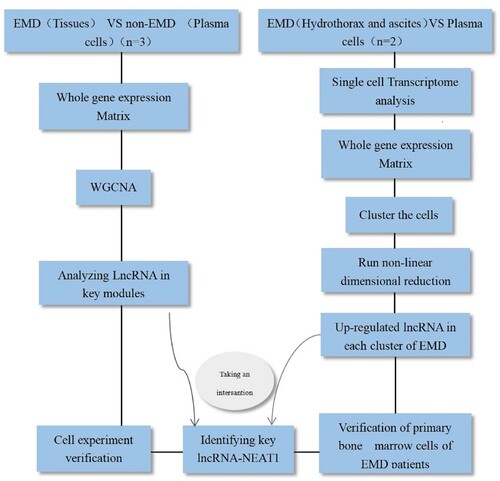
Table 1. Real-time quantitative PCR primer sequences used in this study.
Figure 2. Expression profiles of mRNAs and long non-coding RNAs (lncRNAs) in primary plasma myeloma cells and extramedullary lesions. Volcano Plot of the differentially expressed LncRNAs (A) and mRNAs (B) in primary plasma myeloma cells and extramedullary lesions. The red and green points in the plot represent differentially expressed lncRNAs with statistical significance. Heat map and hierarchical clustering dendrogram of lncRNA (C) and mRNA (D) chips.
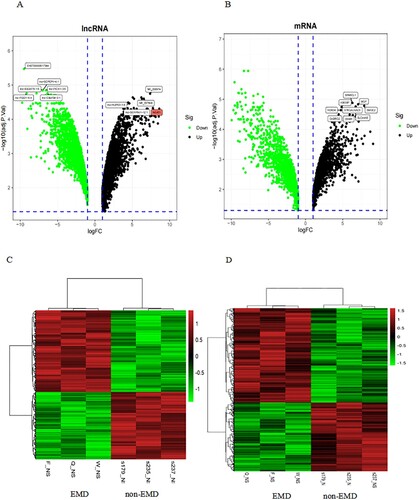
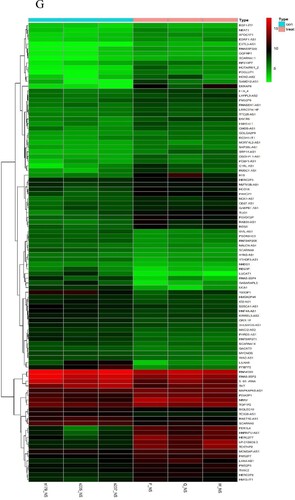
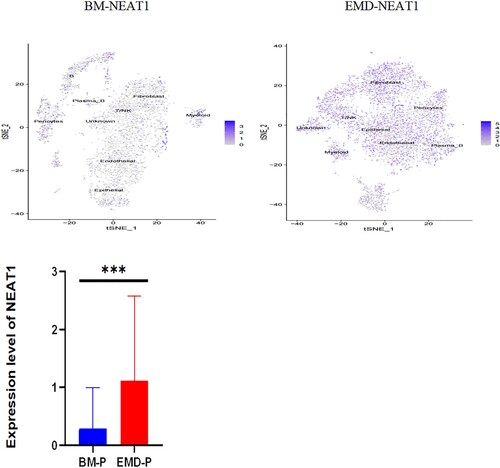
Figure 5. Expression of P53, NEAT1, NEAT1V2, COL1A1 in samples from patients with newly diagnosed EMD, non-EMD, and controls. NEAT1 and NEAT1V2 were significantly upregulated in primary plasma cells with EMD.
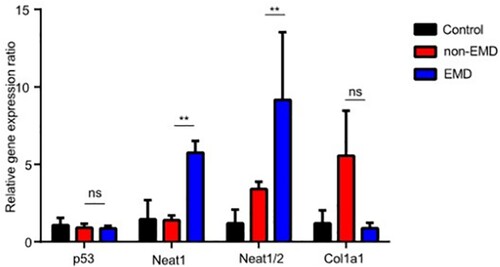
Figure 6. Correlation between NEAT1 expression and overall survival (A)/progression-free survival (B) of multiple myeloma patients (n = 225). Relationship between the expression level of NEAT1 in patients of MM and different clinical parameters in patients in each Oncomine data set (C1–7) (*p < 0.05, **p < 0.01, ***p < 0.005).

Figure 7. Changes of cell proliferation after down regulating the expression level of NEAT1 in RPMI 8266 and U226 cells. The expression levels of NEAT1 and NEAT1v2 in RPMI 8266 (A–B)/U266 cells (C–D) were different before and after NEAT1 knockdown. The viability of U226 (E) and RPMI 8266 (F) cells was detected by CCK-8. Effect of knockdown of NEAT 1 on soft agar cloning of RPMI 8266 (E) and U266 (F) cells. Agar clone formation assay was performed to detect proliferation of RPMI 8266 (G) and U266 cells (H) with low expression of NEAT1.**p < 0.01, ***p < 0.001.
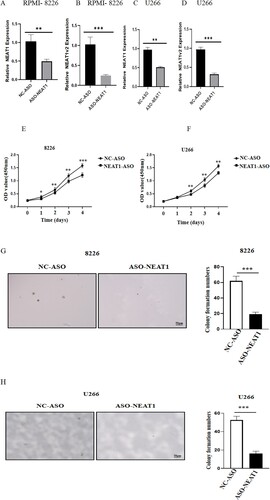
Figure 8. Effect of knockdown of NEAT1 on cell cycle of multiple myeloma cell lines RPMI8266 (A) and U226 (B). **p < 0.01, ***p < 0.001, NC indicates no statistical difference. Mann–Whitney test, n = 3.
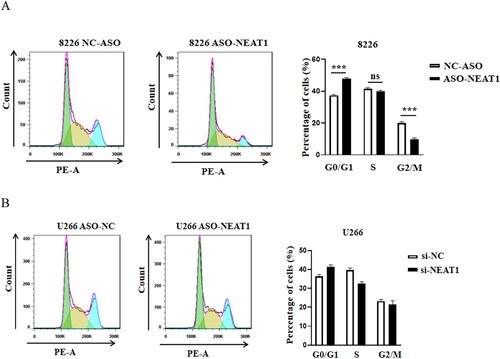
Figure 9. NEAT1 affects the activation of the PI3K/Akt/PTEN pathway in RPMI 8226(A–B) and U266(C–D) cells.

Data availability statement
The datasets used and/or analyzed during the current study are available from the corresponding author on reasonable request.