
Figures & data
Figure 1. The family pedigree: the proband (II-4) is marked with an arrow.
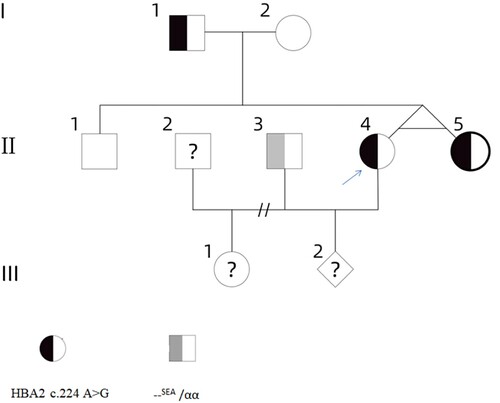
Figure 2. Electropherograms of hemoglobin A plus hemoglobin Chapel Hill, the peaks from left to right being Hb A, Hb Chapel Hill (αChapel Hill 2β2) (zone 7), Hb A2, and Hb Chapel Hill2 (αChapel Hill 2δ2) (zone 1).
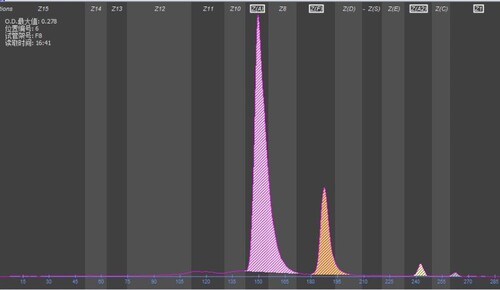
Figure 3. DNA sequencing analysis showing the mutation of HBA2: c.224A > G on the α2 gene. (arrow indicates heterozygous HBA2: c. 224A > G mutation).
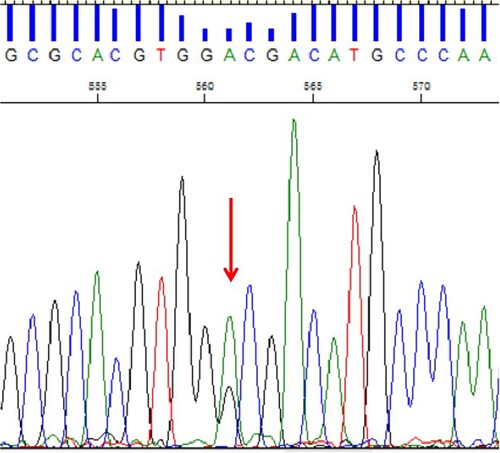
Table 1. Hematological data and genotypes of the family members.