
Figures & data
Table 1. Primer sequences of thalassemia gene by Sanger sequencing.
Table 2. Type and composition ratio of rare hemoglobin variants in the Hb Zone.
Figure 1. (A): The hemoglobin variant Hb Cibeles identified by Sanger sequencing. The arrow shows the mutation of the HBA2 gene (B): Hb Cibeles eluted in Z12 on the Capillarys 2 CE analyzer. The arrow shows the abnormal peak.
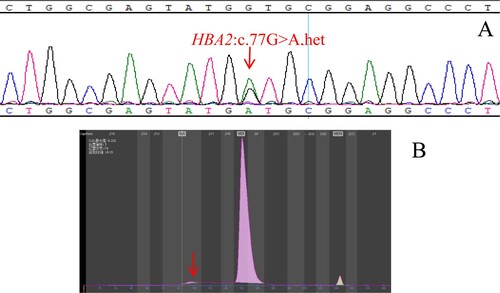
Figure 2. (A): The hemoglobin variant Hb J-Wenchang-Wuming identified by Sanger sequencing. The arrow shows the mutation of the HBA1 gene. (B): Hb J-Wenchang-Wuming eluted in Z12 on the Capillarys 2 CE analyzer. The arrow shows the abnormal peak.
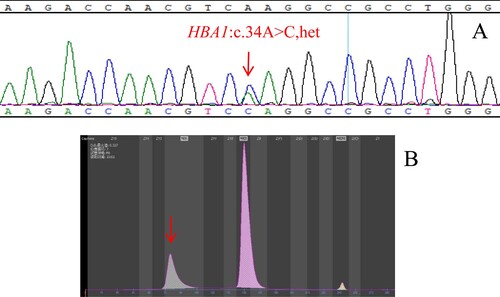
Figure 3. (A): The hemoglobin variants Hb Ube-2 identified by Sanger sequencing. The arrow shows the mutation of the HBA1 gene (B): Hb Ube-2 eluted in Z12 on the Capillarys 2 CE analyzer. The arrow shows the abnormal peak.
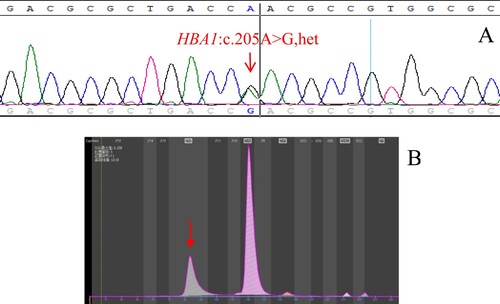
Table 3. The distribution of rare hemoglobin variants.
Table 4. The hematologic phenotype of rare hemoglobin variation in the Hb Zone.
Table 5. Hemoglobin variation in the Hb Zone with thalassemia.
Figure 4. (A): The MLPA(P102) technique detects copy number variation. The proband had a duplicated copy, shown in the blue box region of the β-globin gene cluster. (B): SMRT results of the proband. The arrow shows a 7,412 bp duplicate (hg38 chr11:5,227,051-5,234,462) of the β-globin gene cluster.
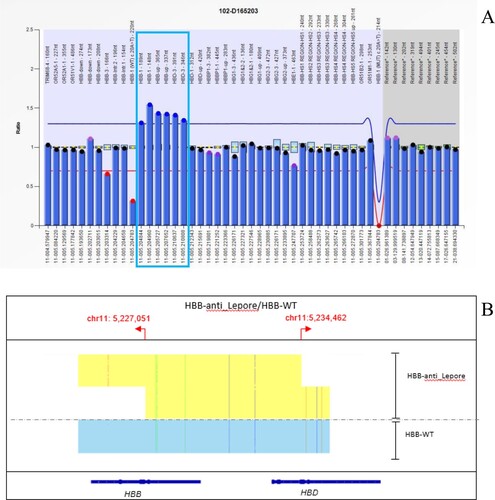
Table 6. Hematologic phenotype of Hb Cibeles carriers.