Figures & data
Table 1. Baseline characteristics of MM patients.
Figure 1. MiRNA-seq data analysis and miR-100-5p expression verification. (A) A volcano plot was applied to visualize expression profiling between MM and control groups. The vertical black dotted lines correspond to a 2.0-fold (log2 scaled) increase and decrease, respectively. The horizontal black dotted refers to a p-value of 0.05 (-log10 scaled). Each red point represents a differentially expressed miRNA with statistical significance. (B) Number of upregulated and downregulated differentially expressed miRNAs in MM patients compared to control individual. (C) Hierarchical clustering indicates differences in miRNA expression profiling between the MM and control groups. (D) Validation experiment of miR-100-5p expression in MM patients. (E) Receiver operating characteristic curves of miR-100-5p. (F) MiR-100-5p targets predicated by miRanda, miRWalk, and PITA databases.
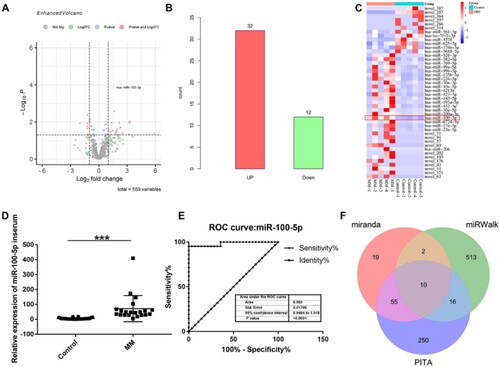
Table 2. Sample details from RNA-seq.
Figure 2. Binding cites predication between miR-100-5p and CLDN11, ICMT, MTMR3, RASGRP3, and SMARCA5 using TargetScan database, and the prognostic role of CLDN11, ICMT, MTMR3, RASGRP3, and SMARCA5 in MM was analyzed using previous cohorts.
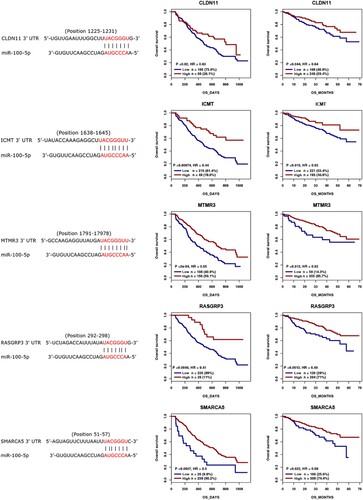
Figure 3. Function analysis of main interactional proteins of CLDN11, ICMT, MTMR3, RASGRP3, and SMARCA5. (A) Mian interactional proteins of CLDN11, ICMT, MTMR3, RASGRP3, and SMARCA5. (B) The top 10 GO terms of MF, BP and CC categories. (C) The top 20 KEGG enrichment pathways. MF, molecular function, BP, biological process, CC, cellular component.
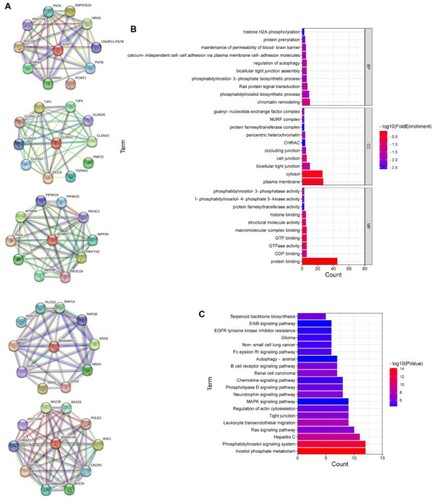
Table 3. Top 10 KEGG pathways.
Figure 4. Function of miR-100-5p in MM cells. (A) qPCR was performed to detect the expression of miR-100-5p in MM cells after 24 h of transfection. (B) CCK-8 was performed to detect the living number of MM cells after 24, 48, and 72 h of transfection. (C) Flow cytometry was performed to detect apoptosis of MM cells after 24 h of transfection. (D) Western blot was performed to detect the expression of apoptosis- and metastasis-associated proteins in MM cells after 24 h of transfection. All Experiments were performed three times. ***p < 0.001.
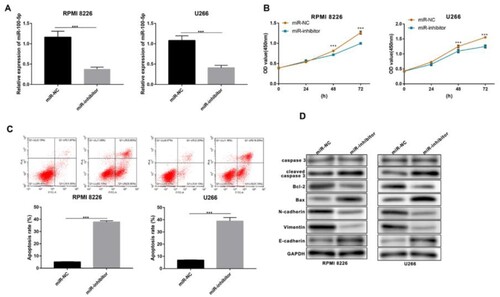
Figure 5. The targets of miR-100-5p expression in MM cells after transfection. (A) qPCR and western blot were performed to detect the expression of CLDN11, ICMT, MTMR3, RASGRP3, and SMARCA5 in MM cells after 24 h of transfection. All Experiments were performed three times. ***p < 0.001 vs. miR-NC group.
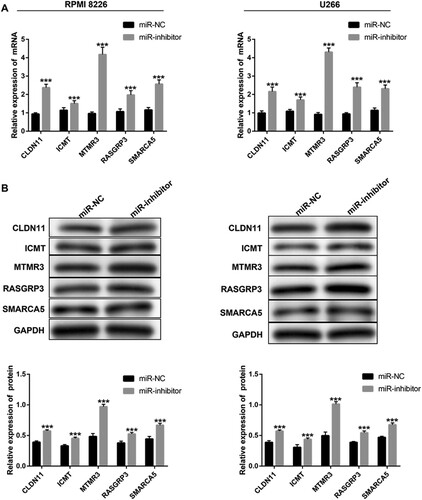
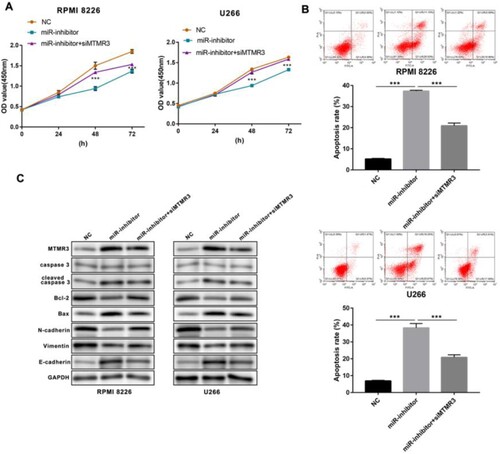
Figure 6. Function of MTMR3 in miR-100-5p inhibited MM cells. (A) CCK-8 was performed to detect the living number of MM cells after 24, 48, and 72 h of transfection. (B) Flow cytometry was performed to detect apoptosis of MM cells after 24 h of transfection. (C) Western blot was performed to detect the expression of apoptosis- and metastasis-associated proteins in MM cells after 24 h of transfection. All Experiments were performed three times. ***p < 0.001.