
Figures & data
Figure 1. Test tube method for detecting the antigen intensity of GA/PFA treated red blood cells with different concentrations. At six months, the antigen intensity of red blood cells treated with 0.005% GA and 0.05% PFA was 4+; the antigen intensity of 0.2% GA+0.05% PFA treated RBCs was 2+ within 24 h; in the third month, the antigen intensity of 0.1% GA+0.05% PFA treated RBCs was 2+, which did not meet clinical application standards.
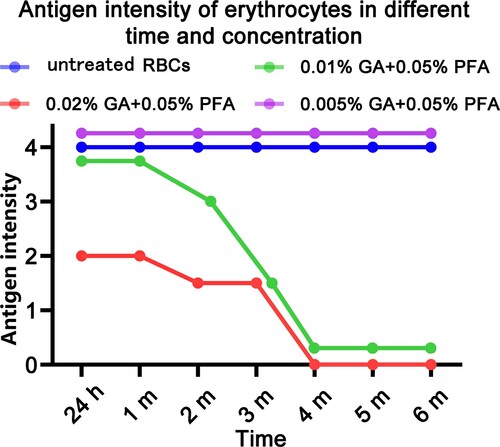
Figure 2. The results of testing a GA/PFA treated red blood cell reagent against an antibody reagent using a microcolumn gel card (Anti-A antibody reagent is contained in the blue gel tubes, whereas anti-B antibody reagent is contained in the yellow gel tubes). In the card test results for the 0.005% GA+0.05% PFA treated red blood cell reagent at the first and sixth months, the negative background was evident and the antigen intensity was 4+. In the first month, the negative background was clearly visible in the card results of red blood cell reagent treated by other concentrations of GA/PFA treated solution, whereas in the sixth month, the negative background was no longer visible.
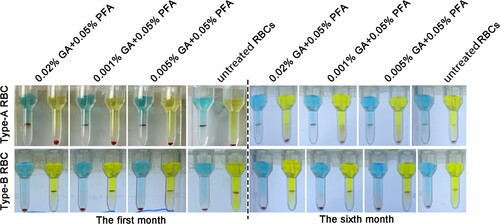
Figure 3. The results of a microcolumn gel card examination of a GA/PFA treated red blood cell reagent in plasma (In the sets of four tubes, the plasma of blood types A, B, O, and AB are arranged from left to right). In the card test results of 0.005% GA+0.05% PFA treated red blood cell reagent at the first and sixth months, the negative background was unmistakable and the antigen intensity was 4+. In the card results of red blood cell reagent treated by other concentrations of GA/PFA treated solution, the negative background was visible in the first month, but it was not visible in the sixth month.
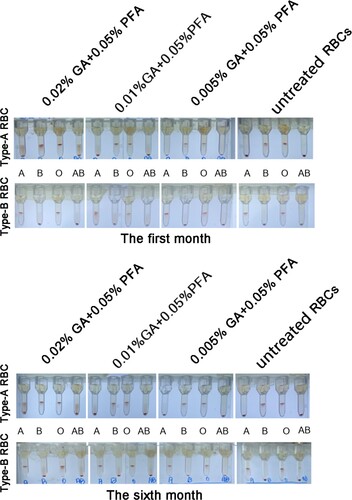
Figure 4. The appearance of RBCs in the first and sixth months after treatment with various concentrations of treated solution. The color of treated red blood cell reagents containing 0.01% GA+0.05% PFA and 0.005% GA+0.05% PFA did not change significantly in the first and sixth months, whereas the color of untreated red blood cell reagents became notably red in the sixth month.
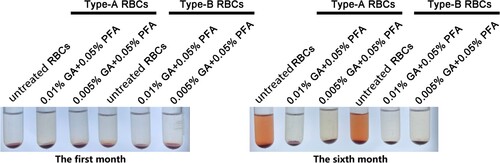
Figure 5. A bar chart for the content of free hemoglobin in supernatant and repeated experiments.
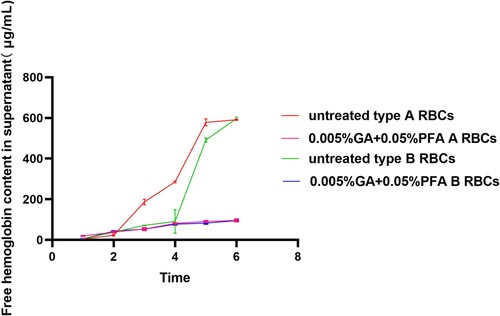
Table 1. Reaction outcomes of red blood cell reagents with antibodies at various dilutions.
Figure 6. The dispersion of red blood cells after six months of storage. At the sixth month, various concentrations of GA/PFA treated red blood cell reagents exhibited good dispersibility under the microscope, with no agglutination or cell overlap.
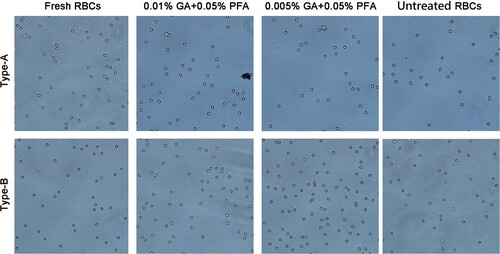
Table 2. Verification of the precision of GA/PFA treated red blood cell reagents using tube tests.
Table 3. Verification of the precision of GA/PFA treated red blood cell reagents using the column gel method.
Supplemental Material
Download MS Word (20.5 KB)Data availability statement
Data available on request from the authors.