
Figures & data
Table 1. Clinical characteristics of 307 newly diagnosed MM patients.
Table 2. Clinical characteristics of 307 newly diagnosed MM patients in different MASS staging.
Figure 1. A: Survival curve of MM patients with stage I, II and III based on R-ISS; B: Survival curve of MM patients in mSMART3.0 low and high risk groups; C: Survival curve of MM patients in MASS stage I, II and III.
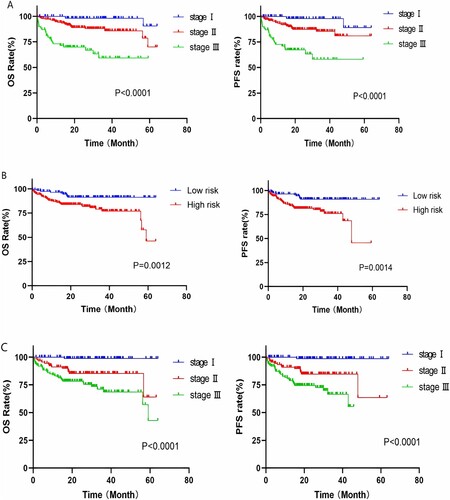
Figure 2. A: Survival curve of patients in PI + IMiDs group with different MASS risk stratification; B: Survival curve of patients in PI + conventional chemotherapy group with different MASS risk stratification; C: Survival curve of patients in IMiDs + conventional chemotherapy group with different MASS risk stratification.
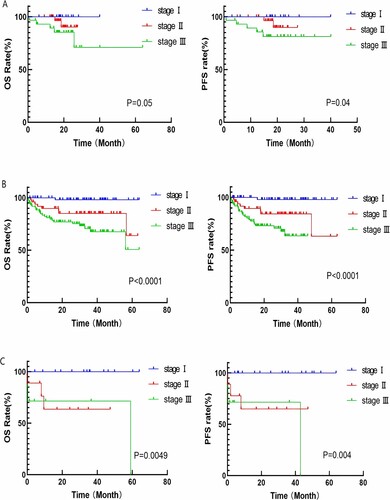
Figure 3. A: Survival curve of patients in senior age group with different MASS risk stratification; B: Survival curve of patients in younger age group with different MASS risk stratification; C: Survival curve of patients in transplant group with different MASS risk stratification; D: Survival curve of patients in non-transplant group with different MASS risk stratification.
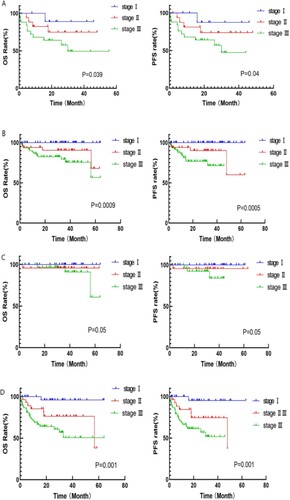
Figure 4. A: Survival curve of patients in normal renal function group with different MASS risk stratification; B: Survival curve of patients in injured renal function group with different MASS risk stratification.
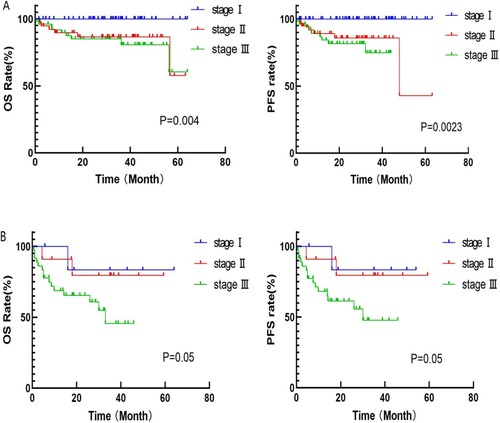
Figure 5. A: Survival curves of patients who are suitable for transplantation but do not undergo transplantation based on MASS risk stratification; B: Survival curve of patients with bone destruction based on MASS.
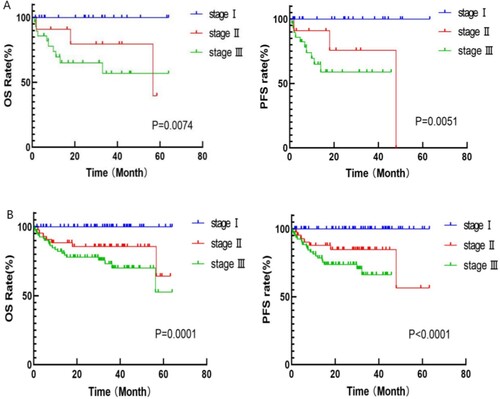
Figure 6. A: Survival curve of MM patients between MM patients with complex karyotype and mSMART single-hit; B: Survival curve of MM patients between MM patients with complex karyotype and mSMART double-hit; C: Survival curve of MM patients between MM patients with complex karyotype and MASSIII.
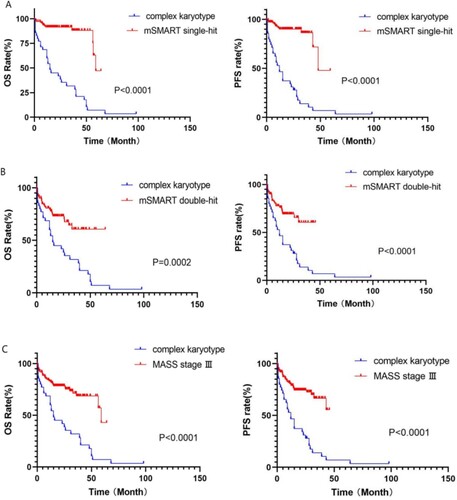
Figure 7. Survive curves of patients with MASS score 2、3 and 4 points.
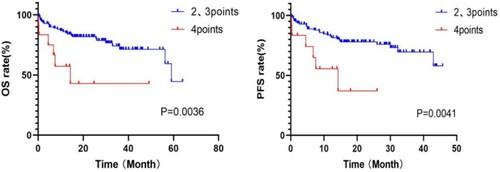
Figure 8. A: Survival curve of patients in mSMART3.0 standard-risk group with different MASS risk stratification; B: Survival curve of patients in mSMART3.0 high-risk group with different MASS risk stratification; C: Survival curve of patients in R-ISS stsge II group with different MASS risk stratification.
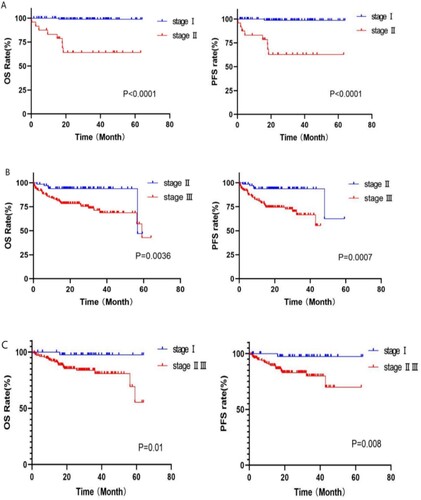
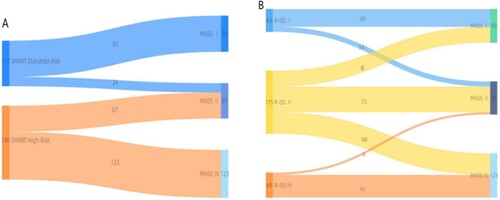
Figure 9. Stage migration between mSMART3.0 and MASS and R-ISS and MASS. The distribution and migration of patients between disease stages using R-ISS, mSMART3.0 and MASS risk stratification systems.
Data availability statement
All data generated or analyzed during this study are included in this article. Further enquiries can be directed to the corresponding author.