Figures & data
Figure 1. DEGs identification and function analysis. (A) Volcano plot and (B) Differential ordering diagram visualizing DEGs in GSE39754. The red dots represent upregulated genes, the blue dots represent downregulated genes. GO and KEGG analysis of upregulated DEGs (C, D) and downregulated DEGs (E, F). In figure C and E, the size of the nodes is proportional to the number of genes, the different color of the nodes represents different ontologies, including biological process (BP), cellular component (CC), molecular function (MF) and Kyoto Encyclopedia of Genes and Genomes (KEGG). In figure D and F, the left half circle includes color modules of genes, the color represents logFC value, the right half circle includes color modules of terms, the size represents the number of genes. DEG, differentially expressed genes.
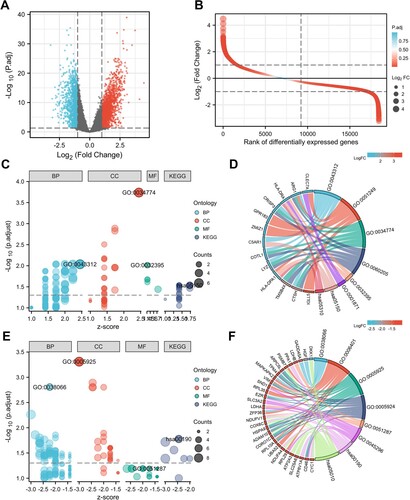
Figure 2. Gene cluster analysis. (A) Sample dendrogram and trait heatmap. The branches of the dendrogram correspond to clustered samples. (B, C) Construction of the scale-free network with a suitable soft-thresholding power (β). (D) Histogram of connectivity distribution when β = 5. (E) Checking the scale free topology when β = 5.
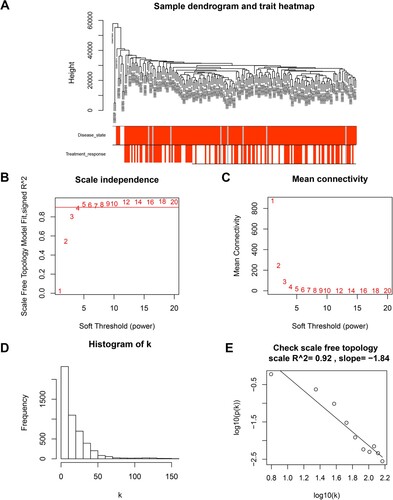
Figure 3. Identification of modules associated with clinical traits of MM. (A) Cluster dendrogram of genes based on dissimilarity measure (1-TOM). (B) Heatmap of the correlation between module eigengenes and clinical traits of MM. (C) Distribution of average gene significance and errors in the modules. (D) The relationship between the module membership and gene significance in the pink module. MM, multiple myeloma; TOM, topological overlap matrix.
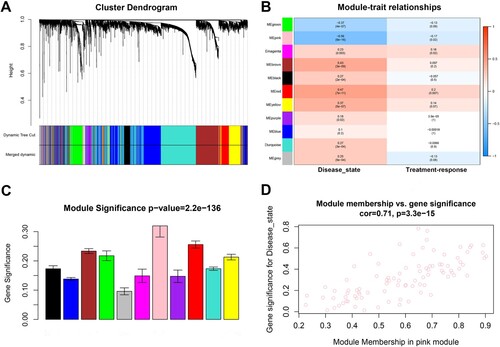
Figure 4. Hub genes identification. (A) Protein-protein interaction (PPI) network visualized by cytoHubba. Nodes represent genes in the pink module. Node size represents connectivity of the gene measured by degree. (B) Venn diagram of the hub genes and hub nodes.
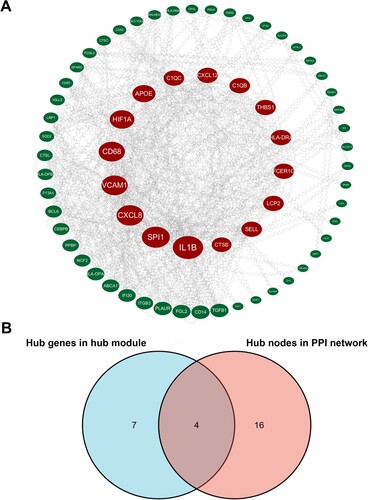
Table 1. Hub genes in the pink module related with disease state.
Figure 5. Validation of gene expression level and prognostic value. (A-D) The expression level of four hub genes (CD68, FCER1G, PLAUR and LCP2) validated in GSE13591. (E-H) Kaplan–Meier survival analysis of four hub genes (CD68, FCER1G, PLAUR and LCP2) in MM patients in GSE2658. MM, multiple myeloma.
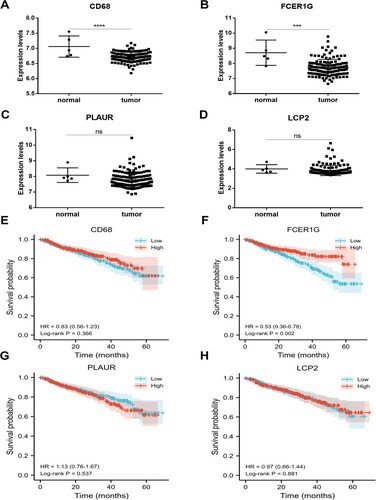
Figure 6. ROC curves of four hub genes (CD68, FCER1G, PLAUR and LCP2) analyzed in GSE39754 (A-D) and GSE13591 (E-H).
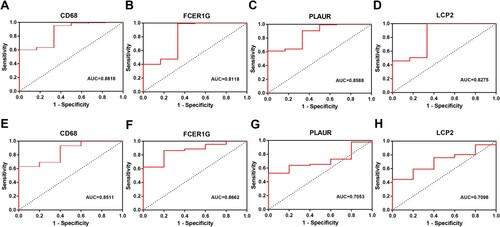
Figure 7. Function and pathway enrichment analysis of hub genes in the pink module. (A) Bar graph of enriched terms of genes colored by P-values. (B) Network of enriched terms colored by P-value. The size of the nodes is proportional to the number of genes. The color depth of the nodes is proportional to the size of P-value. Terms with more genes tend to have more significant P-values.
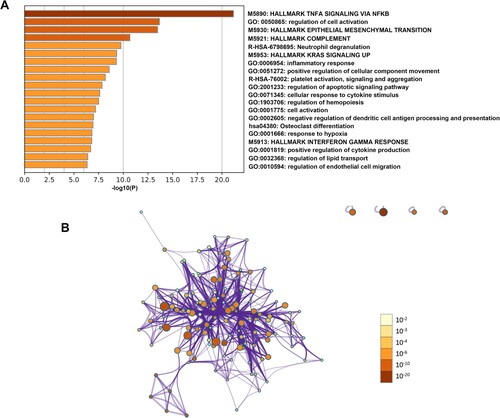
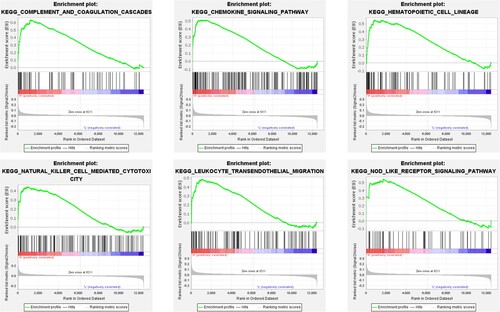
Figure 8. Gene set enrichment analysis. Six significant and representative functional gene sets enriched in MM samples with highly expressed FCER1G were presented. MM, multiple myeloma.