
Figures & data
Figure 1. Flow diagram of the patients.
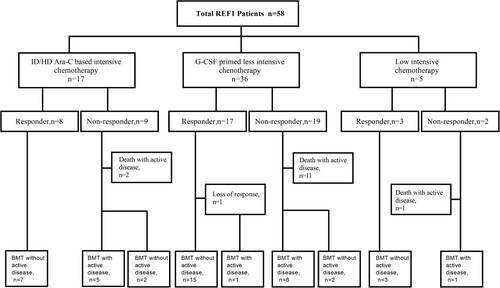
Table 1. Patient characteristics.
Figure 2. Kaplan–Meier curves for overall survival. (a) The whole cohort. (b) ID/HD Ara-C based intensive chemotherapy group vs. G-CSF primed less intensive chemotherapy group. (c) ID/HD Ara-C based intensive chemotherapy group vs. G-CSF primed less intensive chemotherapy group, censored at time of allo-HSCT. (d) Patients who received allo-HSCT vs. those not.
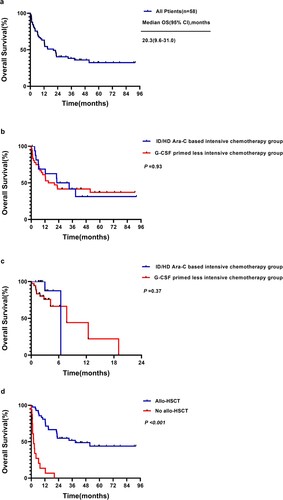
Figure 3. Kaplan–Meier curves for overall survival of the 42 patients underwent allo-HSCT according to (a) reinduction regimen and (b) disease status after salvage treatment.
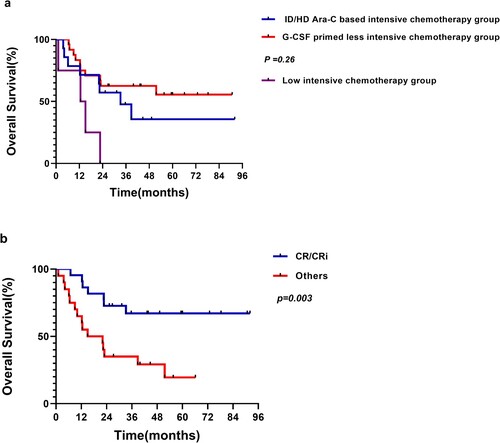
Table 2. Univariate and multivariate analysis of clinical parameters on overall survival.
Data availability statement
The data that support the findings of this study are available from the corresponding author upon reasonable request.