Figures & data
Figure 1. The inhibitory effect of IM in K562 and K562R cells. Imatinib mesylate (IM)-sensitive K562 and IM-resistant K562 cells (K562R) were treated with IM for DMSO as control for 24 h. Cell viability was determined by CCK-8 assays. (A) Statistical analysis of cell viability from K562 and K562R cells, respectively. * p < 0.05; **** p < 0.0001. (B–C) IM decreases the viability of K562 and K562R cells over concentration. 50% inhibition of cell viability (IC50) values was calculated with GraphPad software. Data are presented as mean ± SD of three independent experiments (n = 3) in triplicates.
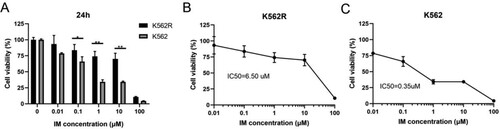
Figure 2. Growth inhibition effects of SH-4-54 on CML cells. Cell viability was measured by CCK-8 assays after treatment of K562R(A) and K562(B) cells with increasing concentrations of SH-4-54 or DMSO as control for different durations. Results are expressed as mean ± SD, and the error bars represent the SD of at least three independent experiments. (A–B) Representative bar graphs * p < 0.05; ** p < 0.01; *** p < 0.001; **** p < 0.0001 vs. control group. (C–D) Representative line graphs *** p < 0.001; **** p < 0.0001 vs. the same concentrations for 24 h.
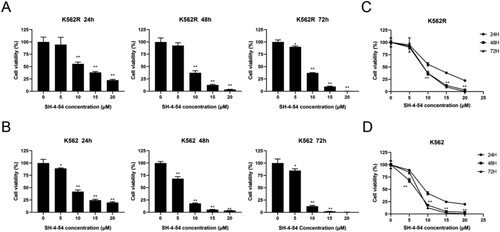
Figure 3. SH-4-54 induced apoptosis in CML cell lines. K562 and K562R cells treated for 24 h with SH-4-54 and DMSO as control were stained with Annexin V/PI to determine the percentages of apoptotic cells. One representative experiment is shown (A). The histogram (B) presents the percentage of apoptotic cells (n = 3 in triplicates, data are mean ± SD, ** p < 0.01 vs. control group). Apoptotic cells are positive for Annexin V (Annexin V + and PI- as early apoptosis, Annexin V + and PI + as late apoptosis).
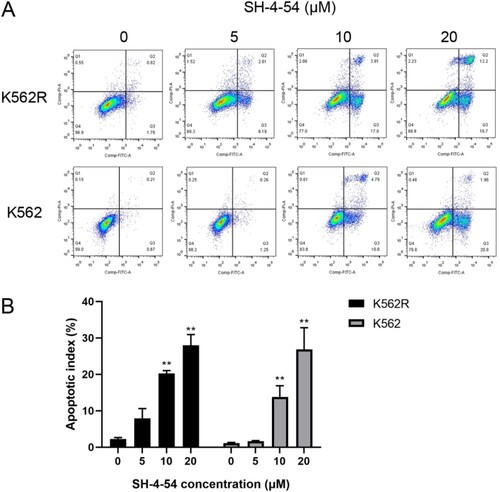
Figure 4. Effects of SH-4-54 on the expression of proteins downstream of BCR-ABL in CML cells. K562 and K562R cells were treated with 0, 5, 10, 15, 20 μM SH-4-54 for 3 h. Then, whole-cell lysates were extracted to assess the levels of STAT3, pSTAT3, STAT5, pSTAT5 by Western blot analysis. GAPDH was used as a loading control. The results are representative of three determinations with identical results.
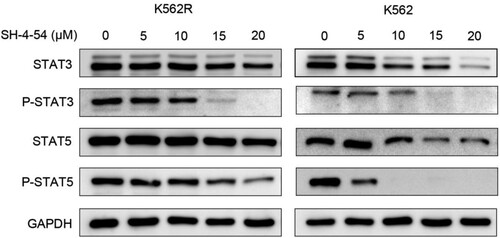
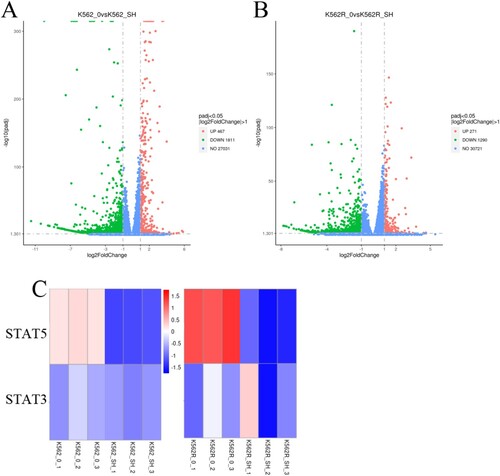
Figure 5. Effects of SH-4-54 on gene expression profile of CML cells. (A-B) Volcano plots of gene expression differences of K562 and K562R cells treated with control or for 20 μM SH-4-54 for 24 h. (C) Heat map of mRNA expression profiles from control (DMSO-treated) and SH-4-54 treated (20 μM, 24 h) K562/K562R cells. The expression of each mRNA corresponds to the average of 3 replicates. Also shown is the correlation of the log fold expression changes of differential expressed genes between two groups. For the SH-4-54 group, transcripts with >2-fold decrease in are shown in green, while those with >2-fold increase are shown in red.