Figures & data
Figure 1. KMT2A is up-regulated in AML PB as well as cell lines. (A) KMT2A expression in AML PB was discovered using a qRT-PCR assay. *P < 0.05 vs. control group. KMT2A mRNA, together with protein expressions, was found using (B) qRT-PCR as well as (C) western blot assays in AML cell lines. *P < 0.05, **P < 0.01 vs. HS-5 cells. All data were exhibited as mean ± SD. n = 3.
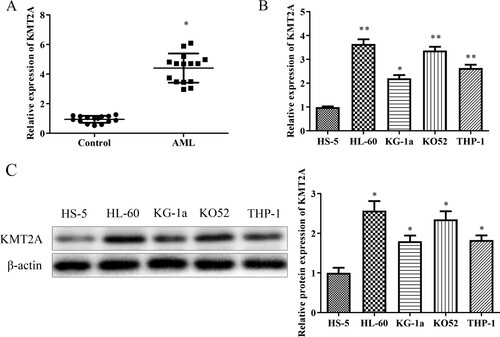
Figure 2. Down-regulation of KMT2A prevents AML cells from proliferating, migrating, and invading. Expression of KMT2A in HL-60 cells and KO52 cells which were transfected with sh-NC or sh-KMT2A was assessed using a qRT-PCR assay (A). (B) The CCK-8 assay was used to explore the vital capability of HL-60 cells and KO52 cells that had been transfected with sh-NC or sh-KMT2A at the specified times. (C) The EdU assay was used to detect the proliferating ability of HL-60 cells and KO52 cells that had been transfected with sh-NC or sh-KMT2A. (D) Western blot assay was used to assess PCNA as well as Ki-67 protein expressions in HL-60 cells and KO52 cells which were transfected with sh-NC or sh-KMT2A. (E) Transwell migration and invasion assays were adopted to evaluate the migration and invasion of HL-60 cells and KO52 cells which were transfected with sh-NC or sh-KMT2A. (F) Western blot assay was adopted to assess the protein expressions of MMP-2 as well as MMP-9 in HL-60 cells and KO52 cells which were transfected with sh-NC or sh-KMT2A. *P < 0.05, **P < 0.01 vs. sh-NC group. All data were exhibited as mean ± SD. n = 3.
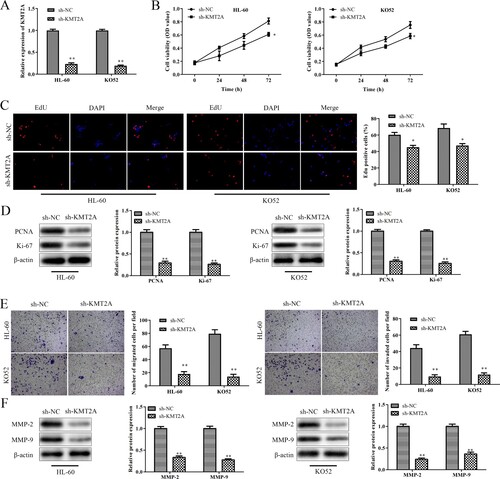
Figure 3. Up-regulation of KMT2A promotes AML cells’ abilities to proliferate, migrate and invade. (A) The expression of KMT2A in HL-60 cells and KO52 cells transfected with pcDNA-NC or pcDNA-KMT2A was assessed using a qRT-PCR experiment. (B) The CCK-8 test was used to determine the viability of HL-60 as well as KO52 cells that had been transfected with pcDNA-NC or pcDNA-KMT2A at the specified periods. (C) An EdU test was used to measure the proliferating ability of HL-60 cells and KO52 cells that had been transfected with either pcDNA-NC or pcDNA-KMT2A. (D) Western blot assay was used to evaluate PCNA and Ki-67 protein expressions in HL-60 cells and KO52 cells which were transfected with pcDNA-NC or pcDNA-KMT2A. (E) Transwell migration and invasion assays were used to determine the abilities to migrate and invade HL-60 cells and KO52 cells which were transfected with pcDNA-NC or pcDNA-KMT2A. (F) Western blot analysis was used to assess the protein expression of MMP-2 and MMP-9 in HL-60 cells and KO52 cells that were transfected with pcDNA-NC or pcDNA-KMT2A. *P < 0.05, **P < 0.01 vs. pcDNA-NC group. All data were exhibited as mean ± SD. n = 3.
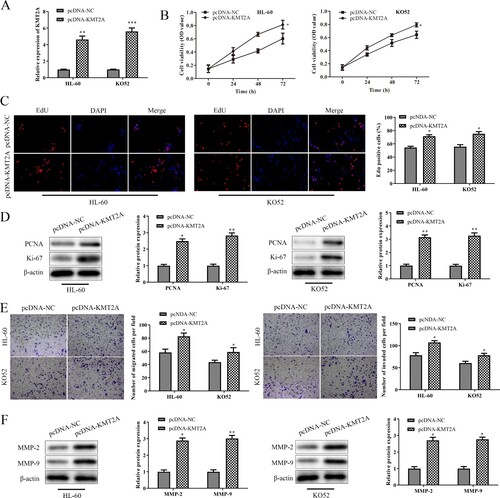
Figure 4. KMT2A is a target gene of miR-361-3p. (A) Using ENCORI and miRWalk, the potential upstream miRNAs of KMT2A were forecast. (B) The interactions between miR-361-3p and KMT2A were proved using a dual-luciferase reporter study. By using (C) qRT-PCR and (D) western blot tests, the mRNA and protein expression of KMT2A in HL-60 cells and KO52 cells that were transfected with NC mimic or miR-361-3p mimic was discovered. **P < 0.01 vs. NC mimic group. The qRT-PCR test was adopted to find miR-361-3p expression in (E) AML PB and (F) cell lines. *P < 0.05, **P < 0.01 vs. control group or HS-5 cells. All data were exhibited as mean ± SD. n = 3.
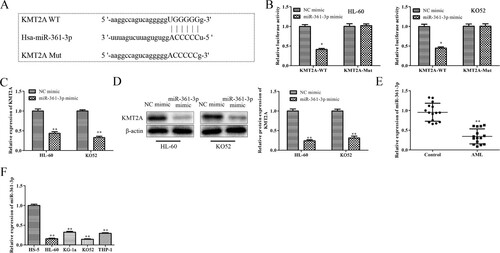
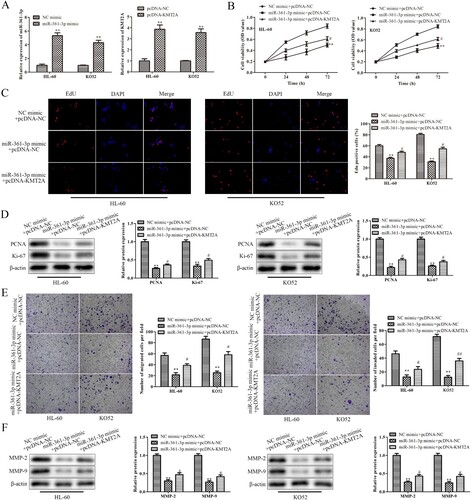
Figure 5. MiR-361-3p regulates the abilities to proliferate, migrate and invade of AML cells via targeting KMT2A. (A) The effectiveness of transfection in HL-60 cells and KO52 cells which were transfected with miR-361-3p mimic or pcDNA-KMT2A was assessed using a qRT-PCR test. **P < 0.01 vs. NC mimic group or pcDNA-NC group. (B) The CCK-8 test was used at the appropriate periods to determine the vitality of HL-60 cells and KO52 cells following transfection. (C) The EdU assay was used to gauge the proliferation of HL-60 cells and KO52 cells following transfection. (D) Western blot analysis was used to assess PCNA and Ki-67 protein expressions in HL-60 cells and KO52 cells after transfection. (E) Transwell migration and invasion assays were used to detect the migrating and invading abilities of HL-60 cells and KO52 cells following transfection. (F) Western blot analysis was used to assess the protein expression of MMP-2 and MMP-9 in HL-60 cells and KO52 cells after transfection. **P < 0.01 vs.NC mimic + pcDNA-NC group, #P < 0.05, ##P < 0.01 vs. miR-361-3p mimic + pcDNA-NC group. All data were presented as mean ± SD. n = 3.