Figures & data
Table 1. Clinical characteristics of newly diagnosed AML patients.
Figure 1. Circ_0104700 was highly expressed in AML samples and cells. (A) Analysis of GSE94591 microarray to select the differential circRNA with LogFC > 4 and P < 0.001. (B) TCGA database showing high expression of circ_0104700 in AML. (C) RT-qPCR was used to detect the expression of circ_0104700 in normal cases (n = 20) and AML patients (n = 26). (D) RT-qPCR was used to detect the expression of circ_0104700 in human bone marrow stromal cells (HS-5) and AML cells (MV-4-11, Kasumi-1, HL-60, and AML2). Compared with Control group or HS-5 cells, **P < 0.01.
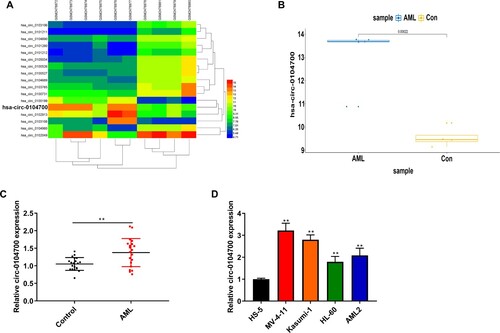
Figure 2. Silencing of circ_0104700 repressed proliferation, cell cycle and induced apoptosis in AML cells. (A) Circ_0104700 expression in MV-4-11 and Kasumi-1 cells was detected by RT-qPCR. (B) MV-4-11 and Kasumi-1 cell viabilities was detected by CCK-8 assay. (C) MV-4-11 and Kasumi-1 cell colony ability was detected by colony formation assay. (D) MV-4-11 and Kasumi-1 cell cycle was detected by flow cytometry. (E) MV-4 11 and Kasumi-1 cell apoptosis was detected by flow cytometry. Compared with si-NC, **P < 0.01.
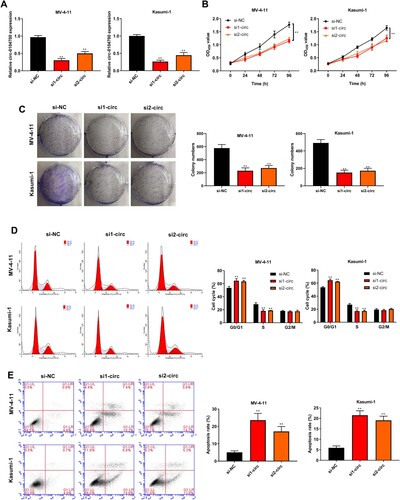
Figure 3. Circ_0104700 negatively regulated miR-665 expression. (A) The predicted targeted miRNAs of circ_0104700 using Circular RNA Interactome online database were intersected with the differentially expressed miRNAs in the microarray analysis of GSE142700 and GSE49665 from GEO database. (B) The binding site of circ_0104700 with miR-665. (C) Luciferase activity was detected by dual luciferase reporter gene assays. (D) miR-665 expression in MV-4-11 and Kasumi-1 cells was detected by RT-qPCR. (E) TCGA database showed the low expression of miR-665 in AML samples. (F) RT-qPCR was used to detect the expression of miR-665 in normal cases (n = 20) and AML patients (n = 26). (G) Correlation analysis of circ_0104700 with miR-665 in AML patients. (H) Level of miR-665 after being pulled down by the circular probe for circ_0104700 and a random probe measured utilizing northern blotting. Compared with Control, si-NC or mimic NC group, **P < 0.01.
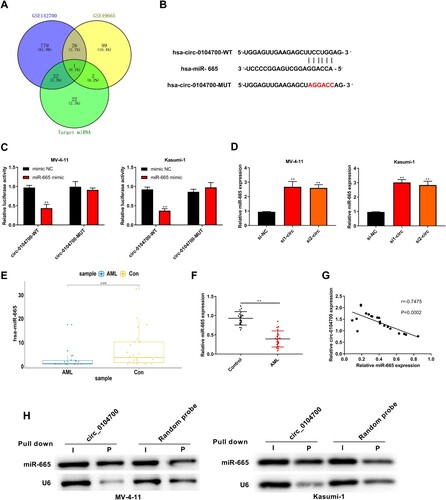
Figure 4. Silencing circ_0104700 inhibited the proliferation, cell cycle and induced apoptosis in AML cells by regulating miR-665. (A) miR-665 expression in MV-4-11 and Kasumi-1 cells was detected by qRT-PCR. (B) MV-4-11 and Kasumi-1 cell viability was detected by CCK-8 assay. (C) MV-4-11 and Kasumi-1 cell colony ability was detected by colony formation assay. (D) MV-4-11 and Kasumi-1 cell cycle was detected by flow cytometry. (E) MV-4 11 and Kasumi-1 cell apoptosis was detected by flow cytometry. Compared with si-NC + inhibitor NC group, *P < 0.05, **P < 0.01; compared with si1-circ group, #P < 0.05, ##P < 0.01; compared with inhibitor group, &P < 0.05, &&P < 0.01.
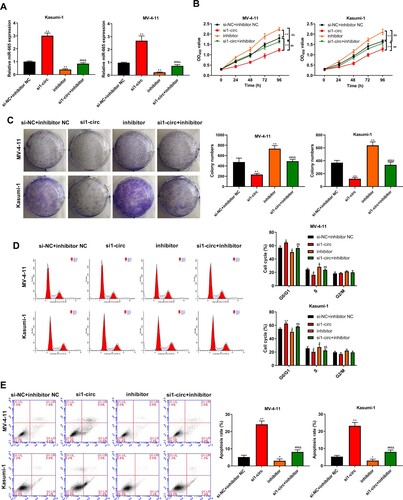
Figure 5. MiR-665 negatively regulated MCM2 expression. (A) The predicted targeted genes of miR-665 using Starbase online database were intersected with the differentially expressed genes in the microarray analysis of GSE94591 and GSE104099 from GEO database. (B) The binding site of MCM2 with miR-665. (C) Luciferase activity was detected by dual luciferase reporter gene assays. (D) TCGA database showed the high expression of MCM2 in AML samples. (E) RT-qPCR was used to detect the expression of MCM2 in normal cases (n = 20) and AML patients (n = 26). (F) Correlation analysis of MCM2 with miR-665 in AML patients. Compared with Control or miminc NC group, **P < 0.01.
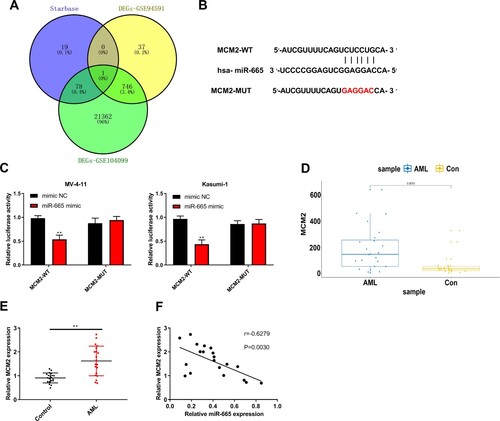
Figure 6. Silencing of MCM2 alleviated the proliferation and cell cycle of AML cells and induces apoptosis by regulating the JAK/STAT signaling. (A) MCM2 expression in MV-4-11 and Kasumi-1 cells was detected by RT-qPCR. (B) MV-4-11 and Kasumi-1 cell viabilities was detected by CCK-8 assay. (C) MV-4-11 and Kasumi-1 cell colony ability was detected by colony formation assay. (D) MV-4-11 and Kasumi-1 cell cycle was detected by flow cytometry. (E) MV-4 11 and Kasumi-1 cell apoptosis was detected by flow cytometry. (F) KEGG downstream pathway prediction for MCM2 using GSEA software. (G) Western blot analysis was used to detected the expression of JAK/STAT signaling-related proteins in MV-4-11 and Kasumi-1 cells. Compared with siCon group, *P < 0.05, **P < 0.01.
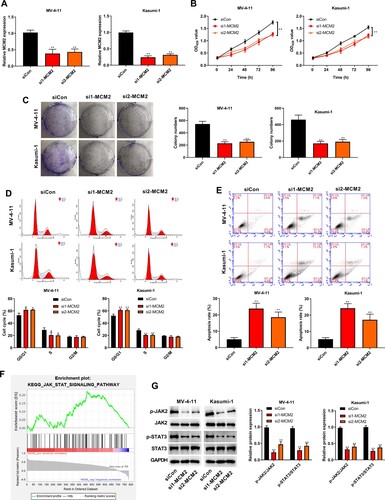
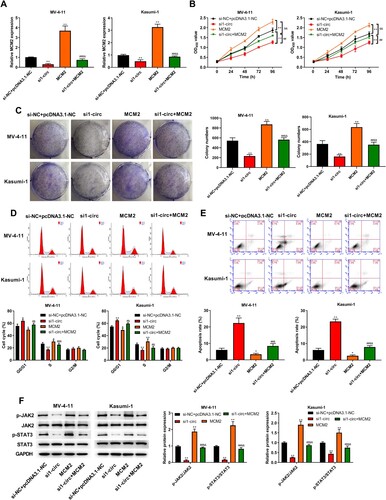
Figure 7. Silencing circ_0104700 inhibited proliferation, cell cycle and induced apoptosis in AML cells by regulating MCM2. (A) MCM2 expression in MV-4-11 and Kasumi-1 cells was detected by RT-qPCR. (B) MV-4-11 and Kasumi-1 cell viabilities was detected by CCK-8 assay. (C) MV-4-11 and Kasumi-1 cell colony ability was detected by colony formation assay. (D) MV-4-11 and Kasumi-1 cell cycle was detected by flow cytometry. (E) MV-4 11 and Kasumi-1 cell apoptosis was detected by flow cytometry. (F) Western blot analysis was used to detected the expression of of JAK/STAT signaling-related proteins in MV-4-11 and Kasumi-1 cells. Compared with si-NC + pcDNA3.1-NC group, *P < 0.05, **P < 0.01; compared with si1-circ group, #P < 0.05, ##P < 0.01; compared with MCM2 group, &P < 0.05, &&P < 0.01.