
Figures & data
Figure 1. Flow diagram of literature screening procedure in the meta-analysis.
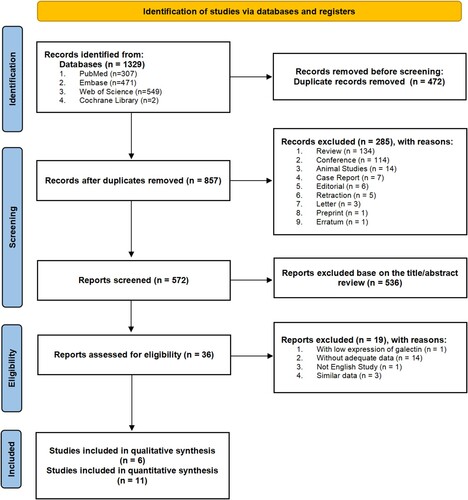
Figure 2. Risk of graph and risk of bias summary of the eligible literatures.
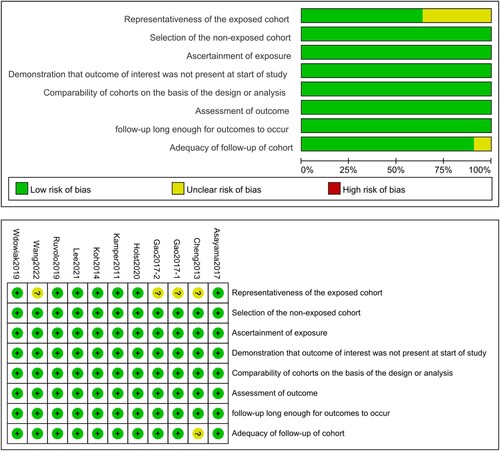
Table 1. The main characteristics of the eligible literatures included in the meta-analysis (n = 11). Studies are ordered by author names.
Figure 3. Forest plots of the association between galectin expression with overall survival (OS). HR stands for hazard ratio, while CI indicates confidence interval.
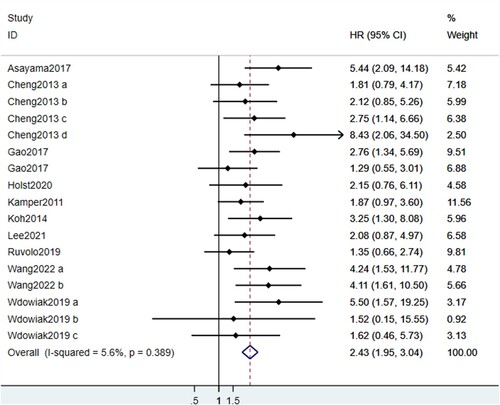
Figure 4. Sensitivity analysis for OS in this meta-analysis.
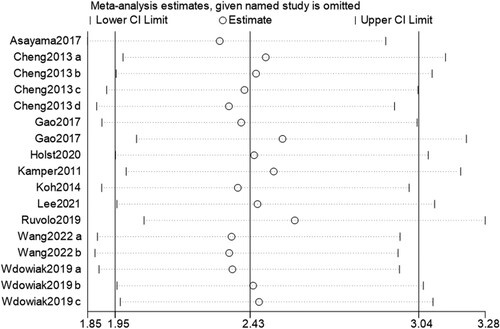
Figure 5. Funnel plot of publication bias of included studies.
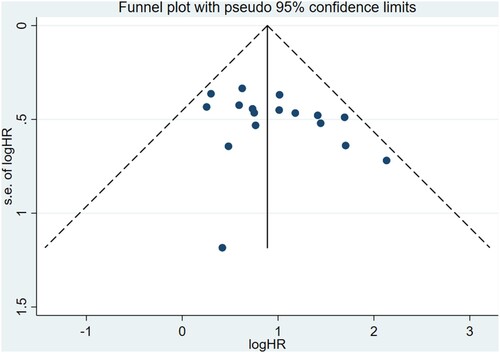
Figure 6. Forest plots of the association between galectin expression with (A) disease-free survival (DFS) and (B) event-free survival (EFS).
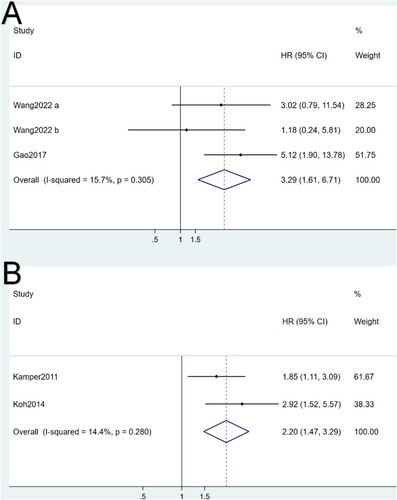
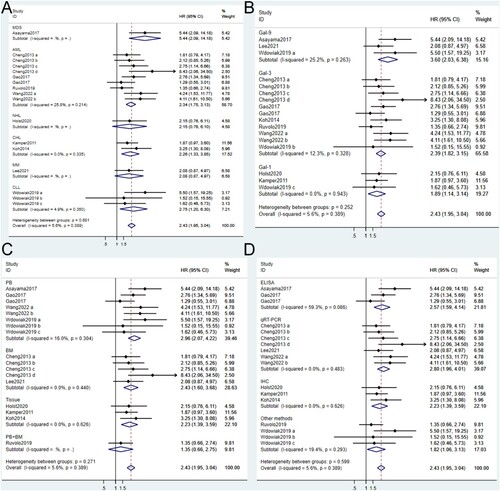
Figure 7. Forest plots of the subgroup analysis of cancer types (A), galectin types (B), sample types (C) and detection methods (D). MDS: myelodysplastic syndrome, AML: acute myeloid leukemia, NHL: non-Hodgkin lymphoma, CHL: classic Hodgkin lymphoma, MM: multiple myeloma, CLL: chronic lymphocytic leukemia, PB: peripheral blood, BM: bone marrow.
Data availability
The data could be obtained by contacting corresponding author.