Figures & data
Figure 1. Overview of single-cell sequencing-based analysis of monocytes and HSCs in peripheral blood and bone marrow. (A) Violin diagram of bone marrow cells after quality control. (B) Selection of highly variable genes. (C) Principal component analysis. (D) 3D PCA plot after cluster analysis. (E) Cell type identification and annotation. (F) Enrichment analysis of DEGs.
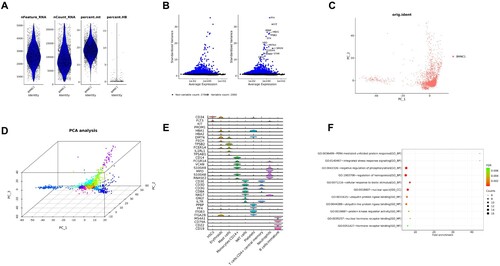
Figure 2. (A) Heatmap of the top 40 DEGs in monocytes compared to peripheral blood with bone marrow. (B) Heatmap of the top 40 DEGs in HSCs compared peripheral blood with bone marrow.
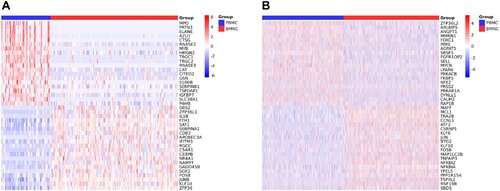
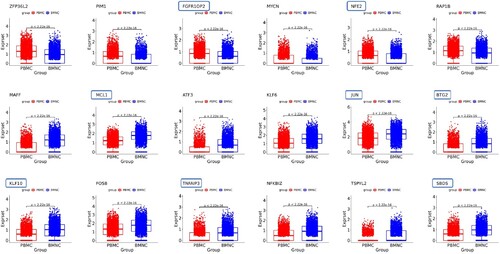
Figure 3. Tumor-associated DEGs in monocytes. Framed genes associated with hematologic malignancies.
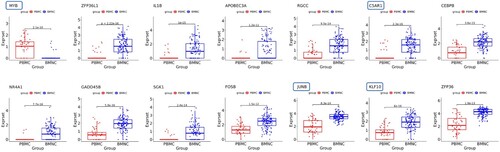
Figure 4. (A)–(D) Enrichment analysis of monocytes. (A) and (B) show bubble and bar charts for enrichment analysis of GO. (C) and (D) show bubble and bar charts for enrichment analysis of KEGG. GO consists of three parts: biological process (BP), molecular functions (MF), cellular components (CC). The length of the bar represents the level of the adjusted P-value (-log10(FDR)), and the longer the bar, the more significant it is. The size of the point represents the number of genes, and the color represents the adjusted P-value (FDR). (E)–(H) Enrichment analysis of HSCs. (E) and (F) show bubble and bar charts for enrichment analysis of GO. (G) and (H) show bubble and bar charts for enrichment analysis of KEGG.
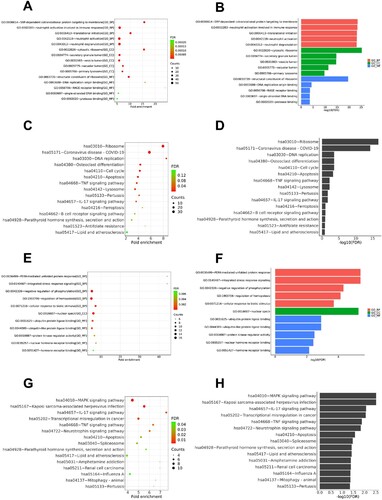
Figure 5. (A)–(C) DEGs network of monocytes after enrichment analysis. (A) Biological process. (B) Cellular components. (C) Molecular functions. (D)–(E) DEGs network of HSCs after enrichment analysis. (D) Biological process. (E) Molecular functions.
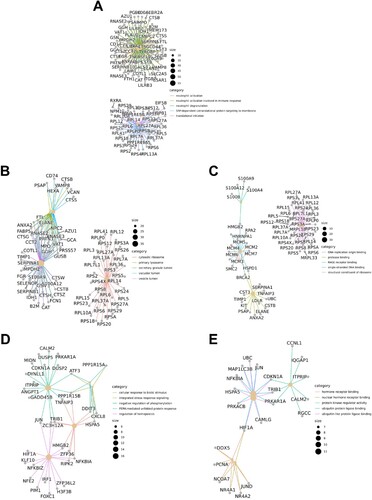
Figure 6. Tumor-associated DEGs in HSCs. Framed genes associated with hematologic malignancies.