
Figures & data
Figure 1. A reverse relationship between platelet counts and levels of serum E2 in a CTP patient. (A–G) Fluctuations of platelet (PLT) counts and serum levels of estradiol (E2) (A), progesterone (P4) (B), insulin (InS) (C), prolactin (PRL) (D), follicle-stimulating hormone (FSH) (E), luteinizing hormone (LH) (F), and testosterone (TTE) (G) of the case.
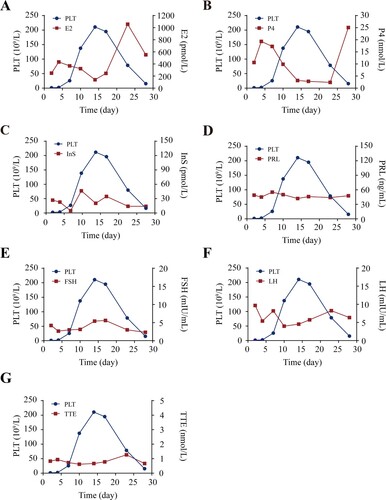
Figure 2. E2 induces platelet apoptosis in vitro. (A) Representative flow cytometric figures (left) and quantification (right) of Δψm depolarization of washed human platelets incubated with E2 or vehicle at 37°C for 96 h (mean ± SD, n = 5). *P < 0.05, **P < 0.01, ***P < 0.001 compared with control, one-way ANOVA. (B and C) Caspase-3 activity analysis (B) and western blot analysis of caspase-3 cleavage (C) in washed human platelets incubated with E2 or vehicle at 37°C for 96 h (mean ± SD, n = 5). **P < 0.01, ***P < 0.001 compared with control, one-way ANOVA. (D) Representative flow cytometric figures (left) and quantification (right) of PS externalization of platelets incubated with E2 or vehicle at 37°C for 96 h (mean ± SD, n = 5). *P < 0.05, **P < 0.01, ***P < 0.001 compared with control, one-way ANOVA.
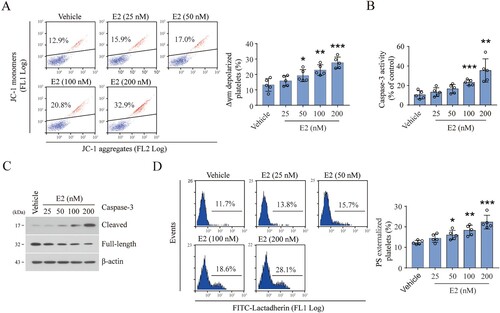
Figure 3. E2 induces platelet apoptosis by inhibiting PKA activity. (A and B) Western blot analysis for the levels of indicated proteins of washed human platelets incubated with E2 or vehicle at 37°C for 96 h. Data are representative of five separate experiments. Quantification (right) of phospho-Bad levels (mean ± SD, n = 5). ***P < 0.001 compared with control, one-way ANOVA. (C–E) Washed human platelets were incubated with forskolin (FSK) or vehicle at 37°C for 10 min and further incubated with E2 (100 nM) or vehicle for 96 h (n = 5). Representative western blots (left) and quantification (right) of phosphor-VASP levels (mean ± SD, n = 5). *P < 0.05, ***P < 0.001 compared with control, one-way ANOVA (C). Representative flow cytometric figures (left) and quantification (right) of Δψm depolarization (D), and representative flow cytometric figures (left) and quantification (right) of PS externalization (E) are shown (mean ± SD, n = 5). *P < 0.05, **P < 0.01 compared with control, one-way ANOVA.
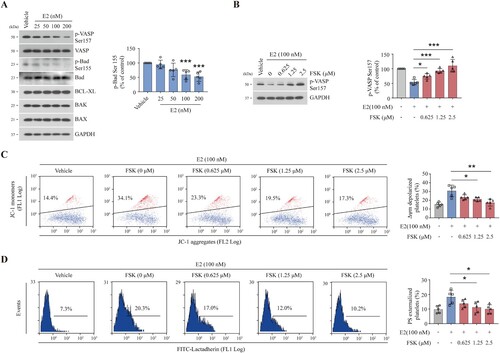
Figure 4. E2 inhibits PKA activity through the regulation of PDE3A. (A) PDE3A activity analysis of washed human platelets incubated with E2 or vehicle at 37°C for 96 h (mean ± SD, n = 5). *P < 0.05, **P < 0.01, compared with control, one-way ANOVA. (B–D) Washed human platelets were incubated with milrinone (2.5 µM) and cilostazol (2.5 µM) or vehicle at 22°C for 20 min and further incubated with E2 (100 nM) or vehicle at 37°C for 96 h (n = 5). Representative western blots (left) and quantification (right) of phosphor-VASP levels (mean ± SD, n = 5). **P < 0.01, ***P < 0.001 compared with control, one-way ANOVA (B). Quantifications of Δψm depolarization (C) and PS externalization (D) are shown (mean ± SD, n = 5). **P < 0.01 compared with control, one-way ANOVA. (E) Schematic representation of proposed mechanism for E2-induced platelet apoptosis. E2 reduces PKA activity by activating PDE3A. The decrease of PKA activity results in dephosphorylation of BAD at Ser155 which leads to mitochondria-dependent apoptosis.
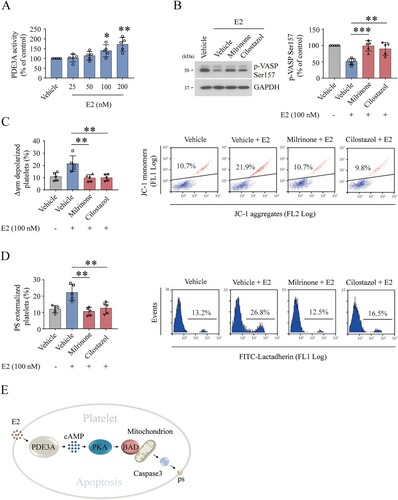
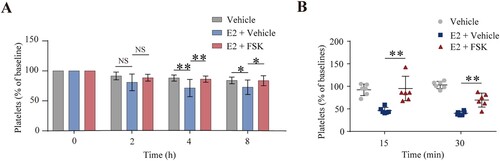
Figure 5. Forskolin rescued the E2-induced thrombocytopenia in mice. (A) WT mice were intraperitoneally injected with forskolin (5 mg/kg) or vehicle 30 min earlier, followed by E2 (1.3 mg/kg) through the eye socket veins. Whole blood was collected from the eye socket veins of the mice at 0 (baseline, before the injection), 2, 4, and 8 h after injection. Platelet counts were performed with Mindray BC-500 Vet Hematologic Analyzer. Data are represented as the mean of the normalized percentage of platelets (time point 0 = 100%) ± SD (n = 9). *P < 0.05, **P < 0.01, two-way ANOVA. (B) Washed mouse platelets were incubated with forskolin (2.5 µM) or vehicle at 22°C for 20 min and further incubated with E2 (100 nM) or vehicle at 22°C for 72 h. The platelets were labeled with calcein and injected into WT mice. The percentage of calcein-labeled platelets remaining in circulation was determined by flow cytometry. Data are represented as the mean of the normalized percentage of calcein-labeled platelets (time point 0 = 100%) ± SD (n = 6). **P < 0.01, two-way ANOVA.
Supplemental Material
Download MS Word (627.1 KB)Data availability statement
The datasets used and analyzed during the current study are available from the corresponding author upon reasonable request.