
Figures & data
Figure 1. Hb analysis by CE showed an abnormal peak migrating to zone F (A). Results of agarose electrophoresis of Gap-PCR amplification products (B): 1. DL2000 (from top to bottom: 2.0, 1.7, 1.4, 1.2, 0.9 kb), 2. -α4.2/αα, 3. -α4.2/-α4.2, 4. Normal. A mutation of GAC>CAC in a heterozygous state was observed at codon 74 of the HBA1 gene using Sanger sequencing, corresponding to Hb Q-Thailand (C).
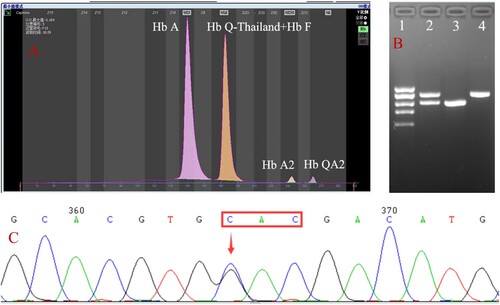
Figure 2. MLPA analysis of the patient. The column chart (red dots) indicated a deletion region extending from probe 391 to 190. The red line diagrams represent the location of type 1 (-α4.2Ⅰ) and type 2 (-α4.2Ⅱ) deletions, respectively.
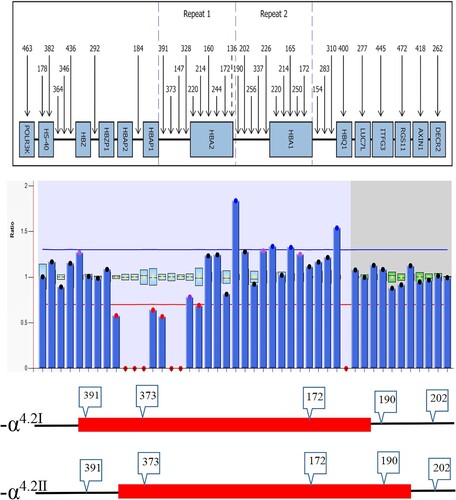
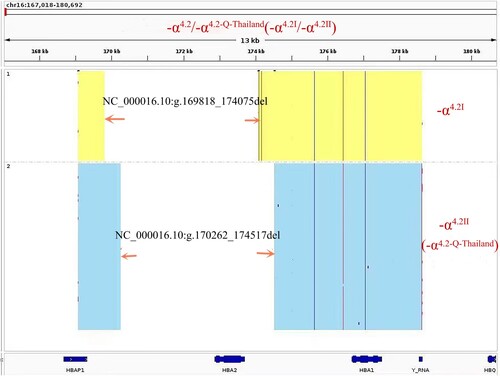
Figure 3. TGS identified two different 4.2 kb deletions in the patient, namely -α4.2Ⅰ and -α4.2Ⅱ.
Data availability statement
All data in this study are shown in the figures and tables.