Figures & data
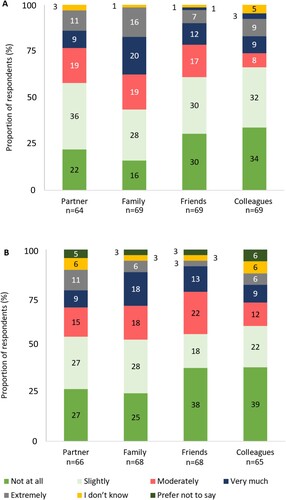
Figure 1. (A) ITP signs and symptoms experienced by respondents (n = 66, excluding responses ‘prefer not to say’ [n = 3]). (B) ITP signs and symptoms ranked by most negatively impactful on quality of life by respondents (n = 66, excluding respondents who experienced no symptoms [n = 3]).
![Figure 1. (A) ITP signs and symptoms experienced by respondents (n = 66, excluding responses ‘prefer not to say’ [n = 3]). (B) ITP signs and symptoms ranked by most negatively impactful on quality of life by respondents (n = 66, excluding respondents who experienced no symptoms [n = 3]).](/cms/asset/8bbfa94b-3a5b-445e-8b88-79d95e554e15/yhem_a_2253069_f0001_oc.jpg)
Figure 2. Respondents’ perceived change in ITP condition since diagnosis (n = 69).
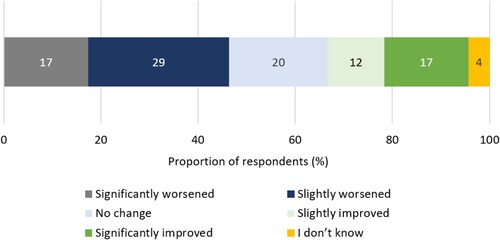
Figure 3. (A) Association between TPO-RA attributes and respondent preference towards TPO-RA treatments (n = 76). The red line indicates no effect (odds ratio = 1). The black lines indicate the lower to upper confidence intervals. (B) Association between TPO-RA attribute levels and respondent preference towards TPO-RA treatments (n = 76). The red line indicates no effect (odds ratio = 1). For each attribute category, the first attribute level plotted is the reference level. The black lines indicate lower to upper confidence intervals. *Two separate tests; one for measuring platelet count and one for liver function. **Must be taken 2 h before or 4 h after food containing dairy products or calcium; indigestion remedies (antacids); or mineral supplements.
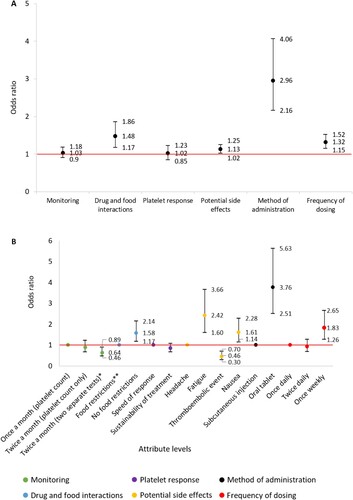
Figure 4. Number of specialist hospital consultant visits pre-COVID-19 (October 2019–March 2020) and post-COVID-19 (March 2020–February 2022) (n = 64).
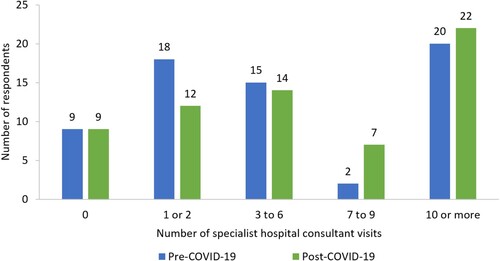
Figure 5. Distance respondents travelled to attend specialist hospital appointments for ITP (n = 64).
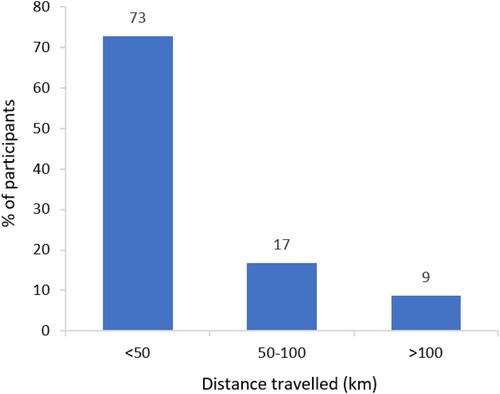
Figure 6. Duration of specialist hospital consultant appointments for ITP (n = 64).
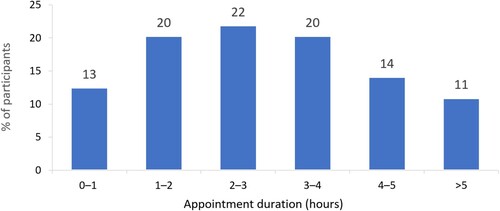
Figure 7. ITP symptoms that have influenced respondents’ ability to fulfil employment responsibilities (n = 55).
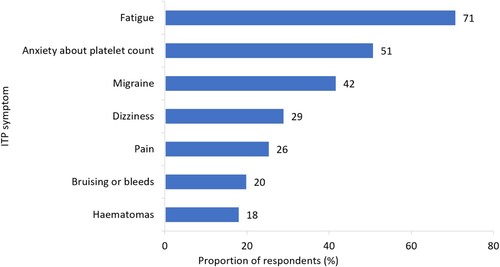
Figure 8. Changes made by respondents to their employment role due to ITP (n = 55).
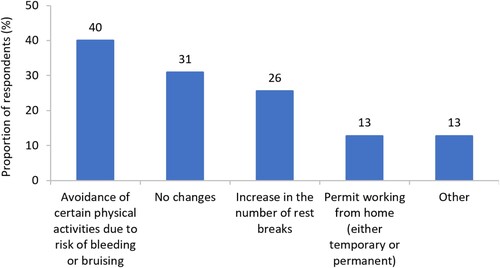
Figure 9. ITP-related concerns that have impacted female respondents’ decision to have children (n = 50, excluding responses ‘I don’t know’ [n = 5]).
![Figure 9. ITP-related concerns that have impacted female respondents’ decision to have children (n = 50, excluding responses ‘I don’t know’ [n = 5]).](/cms/asset/a33d91d2-93c7-4e4e-b08c-ef6883d996e1/yhem_a_2253069_f0009_oc.jpg)
Figure 10. (a) Degree of impact that respondents felt ITP has had on relationships (excluding responses: ‘not applicable’). (b) Change in the degree of impact that respondents felt ITP has had on relationships as disease has progressed since diagnosis (excluding responses: ‘not applicable’). Percentages may not sum to 100 due to rounding.