
Figures & data
Table 1. Clinical information in elderly patients with MM.
Figure 1. The number of death, relapse, or reconstitution of polyclonal Igs.
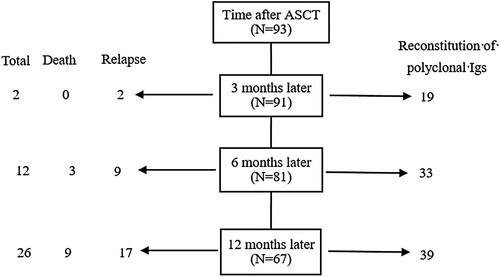
Table 2. Comparison of clinical indicators between Ig reconstitution group and Immunoparesis group.
Figure 2. The predictive roles of Ig. (A) The K-M curve was plotted to analyze the OS outcome. (B) Patients in the immunoparesis group had poor PFS outcomes.
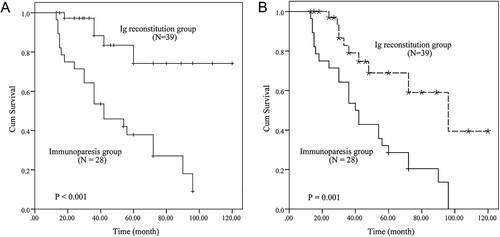
Table 3. Cox analysis of independent indicators for prognosing long-term outcome.