Figures & data
Figure 1. Establishing the AraC-resistant acute myeloid leukemia cells. A: AraC-resistant cell lines were established by increasing AraC concentrations and the viability rate of HL-60 and HL-60/AraC or THP-1 and THP-1/AraC after the treatment with different AraC doses. B: RI of HL-60/AraC and THP-1/AraC cells to AraC. RI = IC50 (AML cells/AraC) / IC50 (AML cells). Data: mean ± SEM. n = 3.
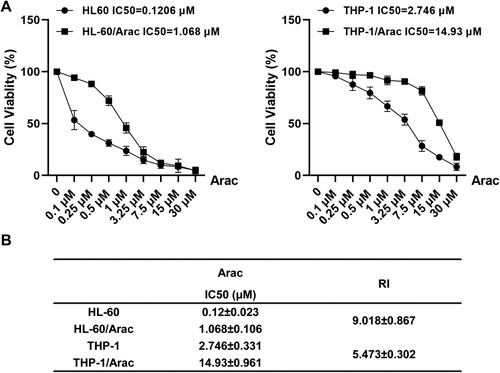
Figure 2. ART effectively reverses AraC resistance in AraC-resistant AML cells. A: The chemical structure formula of ART. B: CCK-8 assay measurement of the cell viability of the HSPC-1 cells intervened with a series of ART concentrations (0.1, 0.5, 1, 2, 5, and 10 μM). C: CCK-8 assay measurement of the cell activity of the HL-60/AraC and THP-1/AraC cells intervened with a series of ART concentrations (0.05, 0.1, 0.2, 0.4, and 0.8 μM). D: CCK-8 assay measurement of cell viability of the HL-60/AraC and THP-1/AraC cell lines intervened with AraC (IC50) and ART (0.05 μM) alone or together. E: Flow cytometry measurement of the cell apoptotic rate in the HL-60/AraC and THP-1/AraC cell lines intervened with AraC (IC50) and ART (0.05 μM) alone or together. Data: mean ± SEM. *P < 0.05, **P < 0.01, ***P < 0.001 vs Control group. #P < 0.05, ##P < 0.01 vs AraC group. n = 3.
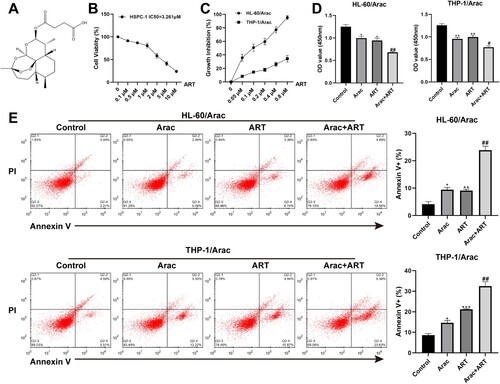
Figure 3. ART suppresses JAK/STAT3 signaling in AraC-resistant AML cells. A: Western blotting measurement of p-JAK2, p-STAT3, JAK2, and STAT3 protein levels in AraC-sensitive and AraC-resistant AML cells. B: Western blotting measurement of p-JAK, p-STAT3, JAK, and STAT3 protein levels in the HL-60/AraC cells treated with AraC (IC50) and ART (0.05 μM) alone or together. C: Western blotting measurement of p-JAK2, p-STAT3, JAK2, and STAT3 protein levels in the THP-1/AraC cells treated with AraC (IC50) and ART (0.05 μM) alone or together. Data: mean ± SEM. **P < 0.01, ***P < 0.001. n = 3.
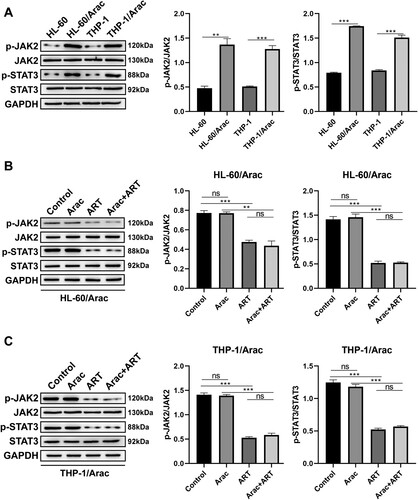
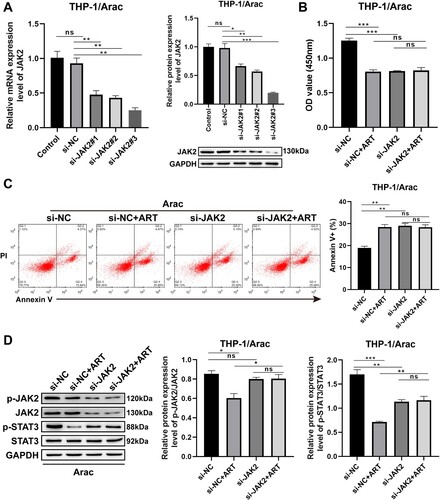
Figure 4. Function of ART on reversing AraC resistance in THP-1/AraC cells relies on JAK/STAT3 signaling. A: RT-qPCR (left) and Western blotting (right) assessment of the mRNA and protein levels of JAK2 in THP-1/AraC cells transfected with si-JAK2#1, si-JAK2#2, and si-JAK2#3. B: CCK-8 assessment of the proliferation ability of THP-1/AraC cells transfected with si-JAK2#3 and/or ART intervention. C: Flow cytometry measurement of the cell apoptotic rate of THP-1/AraC cells transfected with si-JAK2#3 and/or ART intervention. D: Western blotting measurement of p-JAK2, p-STAT3, JAK2, and STAT3 protein levels in the THP-1/AraC cells transfected with si-JAK2#3 and/or ART intervention. Data: mean ± SEM. *P < 0.05, **P < 0.01, ***P < 0.001. n = 3.