Figures & data
Figure 1. Family lineage chart.
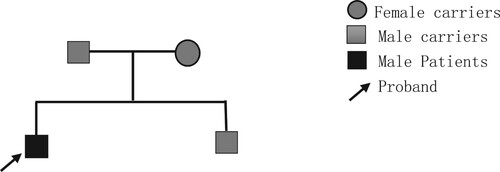
Table 1. Hematological phenotypic analysis of Proband 1 and its family lineage.
Figure 2. Family lineage chart.
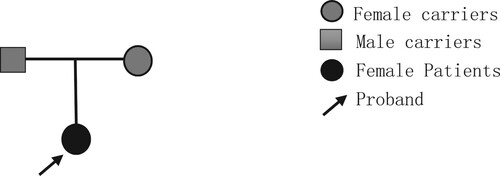
Table 2. Hematological phenotypic analysis of Proband 2 and its family lineage.
Table 3. Primer sequences and amplification fragments of HBB gene.
Figure 3. MLPA assay map of the mother of Proband 1 and controls (normal individuals without thalassemia). a. MLPA assay map of the mother of Proband 1 b. MLPA assay map of the mother of controls (normal individuals without thalassemia). The Proband 1's mother showed a 49% decrease in expression at the 166nt probe compared to the control, suggesting a heterozygote deletion. All are pointed out with arrows in the figure.
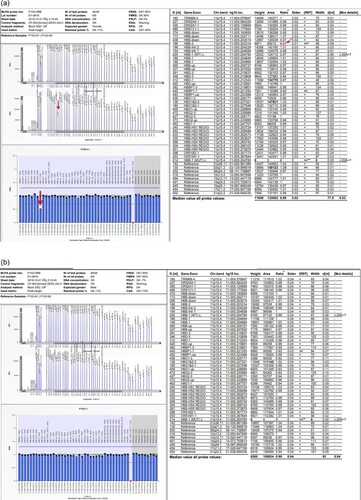
Figure 4. GAP-PCR results of Proband 1 and its family lineage: I. DNA Marker. II.a. From left to right, the second exon PCR results for Proband 1, Proband 1's father, and Proband's sibling. b. Proband 1’s mother exon 3 PCR results. c. Proband 1 exon 3 PCR results. Because Proband 1 is a double heterozygous mutation, the bar has multiple bars.
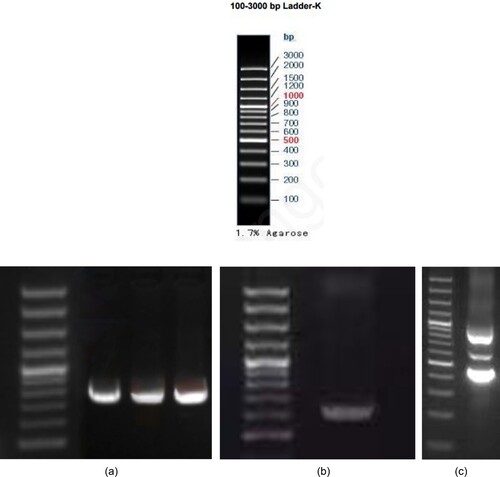
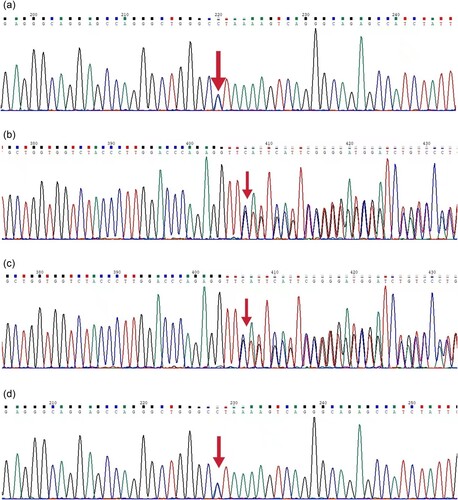
Figure 5. Sequencing map of Proband 1 and its family lineage. : a. a sequencing map of the second exon of Proband 1, c.124_127delTTCT. b. a sequencing map of the second exon of Proband 1’s sibling, c.124_127delTTCT. c. a sequencing map of the second exon of Proband 1’s father, c.124_127delTTCT.d. a sequencing map of the third exon of Proband 1, exon3del. e. a sequencing map of the third exon of Proband 1’s mother, exon3del.
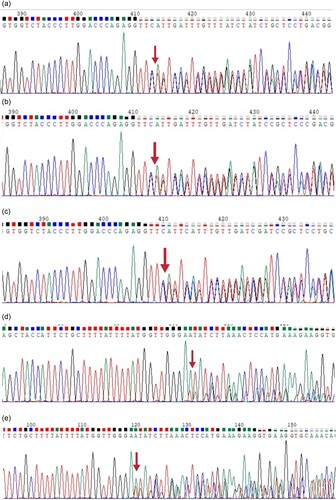
Figure 6. GAP-PCR results of Proband 2 and its family lineage. I. : I: a. Proband 2 promoter region and exon 1 PCR results. b. Proband 2’s mother region and exon 1 PCR results. c. Proband 2 exon 2 PCR results. d. Proband 2’s father exon 2 PCR results. (DNA Marker same as I)
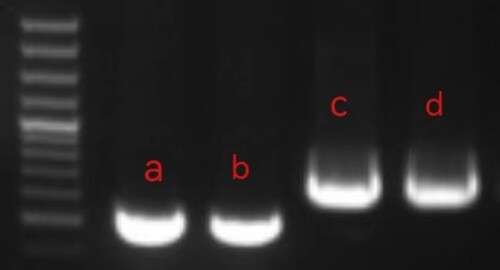
Figure 7. Sequencing map of Proband 2 and its family lineage. . a. a sequencing map of the promoter region of Proband 2 with C/A at position 220 as c.−81A > C. b. a sequencing map of the second exon of Proband 2, c.124_127delTTCT.c. a sequencing map of the second exon of Proband 2’s father, c.124_127delTTCT. d. a sequencing map of the promoter region of Proband 2’s mother with C/A at position 220 as c.−81A > C.