
Figures & data
Figure 1. (A) ITP signs and symptoms experienced by respondents (n = 69). (B) ITP signs and symptoms ranked by most negatively impactful on quality of life by respondents (n = 68) (excluding responses ‘no symptoms’ [n = 1]). Percentages may not sum to 100 due to rounding. *Heavy menstrual bleeding calculated as % of female cohort (n = 45).
![Figure 1. (A) ITP signs and symptoms experienced by respondents (n = 69). (B) ITP signs and symptoms ranked by most negatively impactful on quality of life by respondents (n = 68) (excluding responses ‘no symptoms’ [n = 1]). Percentages may not sum to 100 due to rounding. *Heavy menstrual bleeding calculated as % of female cohort (n = 45).](/cms/asset/0cba9734-76e0-4cec-8743-8a5a661ebba4/yhem_a_2267942_f0001_oc.jpg)
Figure 2. Respondents’ perceived change in ITP condition since diagnosis. Percentages may not add up to 100 due to rounding.
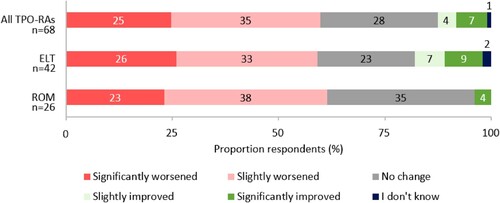
Figure 3. Degree of agreement to statements relating to respondents’ most recent TPO-RA (excluding responses ‘I don’t know’ and ‘prefer not to say’). Percentages may not sum to 100 due to rounding.
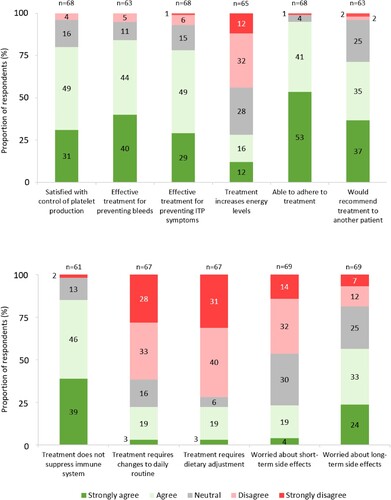
Figure 4. (A) Association between TPO-RA attributes and respondent preference towards TPO-RA treatments (n = 76). The red line indicates no effect (odds ratio = 1). The black lines indicate the lower to upper confidence intervals. (B) Analysis of respondent preference between TPO-RA attribute levels (n = 76). The red line indicates no effect (odds ratio = 1). For each attribute category, the first attribute level plotted is the reference level. The black lines indicate lower to upper confidence intervals. *Two separate tests: one for measuring platelet count and one for liver function. **Must be taken 2 h before or 4 h after, food containing dairy products or calcium; indigestion remedies (antacids); or mineral supplements.
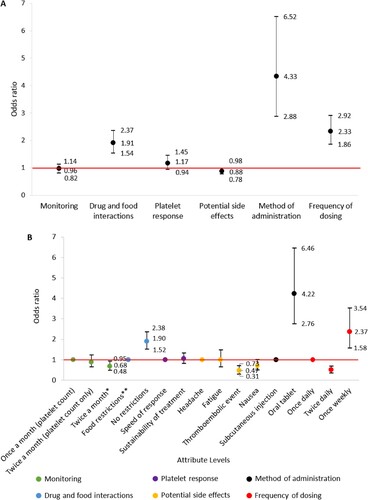
Figure 5. (A) Respondents’ typical weekly working hours, by gender (n = 50). (B) Respondents’ reduction in weekly working hours due to ITP (n = 47) (Excluding responses ‘I don’t know’ [n = 3]). Percentages may not add up to 100 due to rounding.
![Figure 5. (A) Respondents’ typical weekly working hours, by gender (n = 50). (B) Respondents’ reduction in weekly working hours due to ITP (n = 47) (Excluding responses ‘I don’t know’ [n = 3]). Percentages may not add up to 100 due to rounding.](/cms/asset/6e5033b9-6e9a-4cf1-a03c-f2a5a7ba146f/yhem_a_2267942_f0005_oc.jpg)
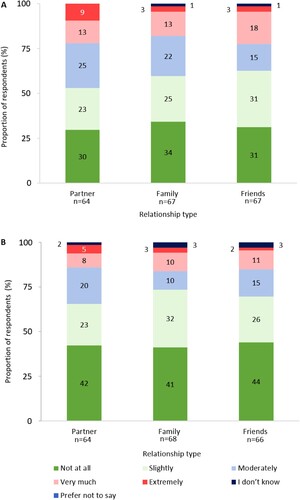
Figure 6. (A) Degree of impact ITP has had on relationships (excluding responses: ‘not applicable’). (B) Degree that the impact of ITP on relationships has changed as disease has progressed (negatively) since diagnosis (excluding responses: ‘not applicable’). Percentages may not sum to 100 due to rounding.
Supplemental Material
Download MS Word (66 KB)Data availability statement
Data supporting the findings presented here are available from the corresponding author upon reasonable request.