
Figures & data
Table 1. Characteristics of patients and controls.
Figure 1. Alterations of the alpha and beta diversity in ITP patients. (a–c) were Sobs, Shannon and Simpson indexes, respectively. (d–e) were the beta diversity by PCoA and NMDS, respectively.
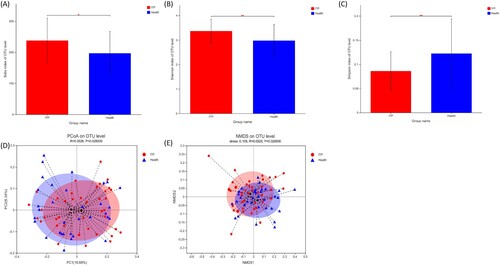
Figure 2. Composition (a) and differences (b, c) in intestinal flora at the phylum level between the ITP group and the healthy control group. (a) and (b) were the result of 16S rRNA, and C was the results of metagenomics.
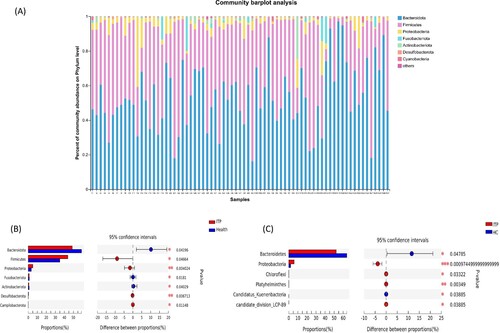
Figure 3. Differences at the genus level. (a) and (b) showed the top 30 genera with differences by 16S rRNA and metagenomics, respectively. (c) and (d) were the analysis of LEfSe by 16S rRNA and metagenomics, respectively.
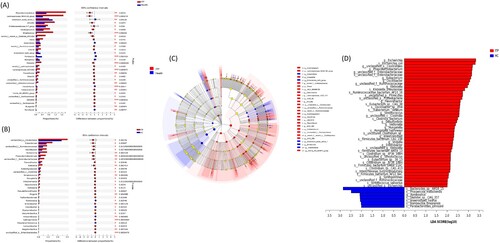
Figure 4. Differences at the species levels. (a) showed the top 30 species with differences by metagenomics. (a) was the differential species analyzed by LEfSe.
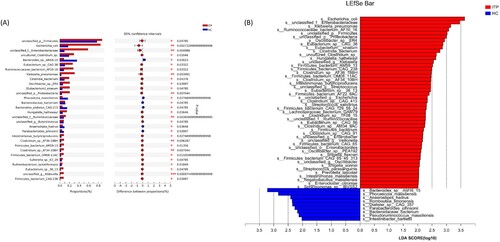
Figure 5. Differences among different stages of ITP. (a) The number of OTUs in three groups. (b) LefSe analysis of intestinal microflora among different stages of ITP.
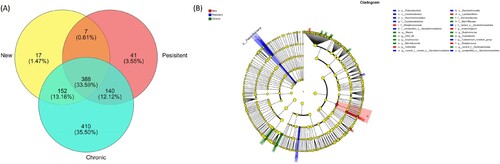
Figure 6. Heatmap of the relationship between bleeding-related indicators and intestinal flora in the ITP group. * P < 0.05,** P < 0.01.
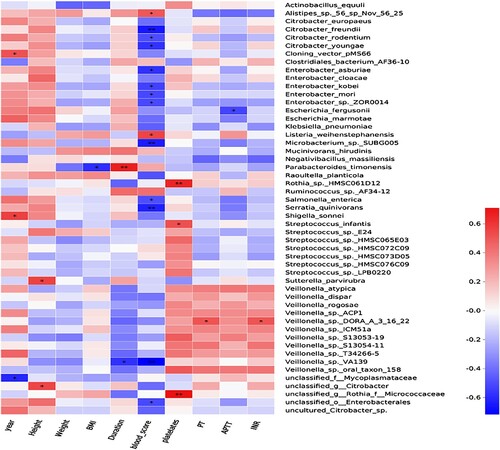
Figure 7. Relationship between IL-2/4 and intestinal flora in ITP patients. (a) and (b) were the levels of IL-2 and IL-4, respectively. (c–h) were the MaAslin analysis of specific bacteria with IL-2. (i–m) were the MaAslin analysis of specific bacteria with IL-4.
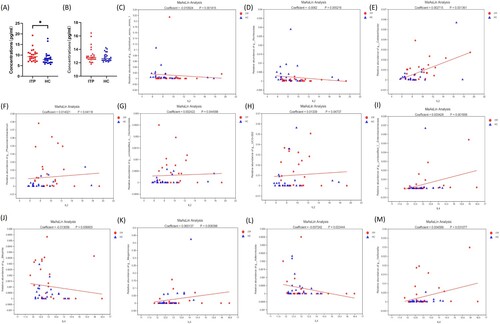
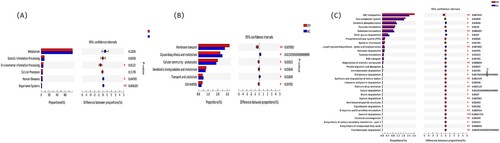
Figure 8. Differences of intestinal flora at the primary (a), secondary (b) and tertiary (c) pathways of KEGG between ITP patients and healthy controls.
Data availability statement
All data and materials during this study are available from the corresponding author on reasonable request. The datasets generated during the current study are available in the Sequence Read Archive (SRA) with BioProject No. PRJNA858054 (https://dataview.ncbi.nlm.nih.gov/object/PRJNA858054) and PRJNA858062 (https://dataview.ncbi.nlm.nih.gov/object/PRJNA858062).