
Figures & data
Figure 1. Chart illustrating the study flow. A total of 56 pediatric AML patients and 100 parents were enrolled and randomized into the CBSM group and the NC group to receive 10-week CBSM and NC, respectively. The questionnaire scores were evaluated at M0, M1, M3, and M6.
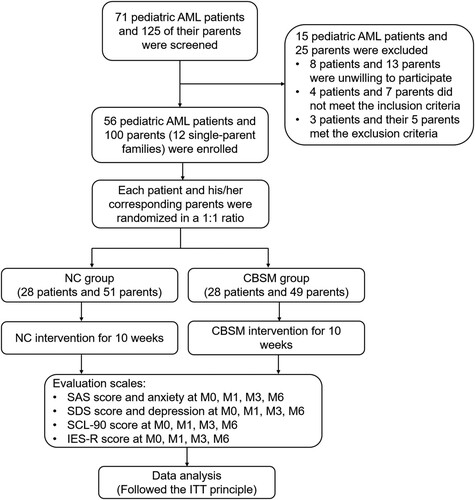
Table 1. Clinical characteristics of pediatric AML patients.
Table 2. Clinical characteristics of parents.
Table 3. Comparison of SAS score and anxiety in parents.
Table 4. Comparison of SDS score and depression in parents.
Table 5. Comparison of SCL-90 score in parents.
Table 6. Comparison of IES-R score in parents.
Table 7. Subgroup analysis of outcomes at M6 in parents.
Supplemental material