Figures & data
Table 1. Clinical characteristics and response to treatment of with t(15;17) APL patients.
Figure 1. Survival outcomes for APL patients according to the presence of ACAs or trisomy 8. (A) OS in the ACAs group; (B) DFS in the ACAs group; (C) OS in the trisomy 8 group; (D) DFS in the trisomy 8 group.
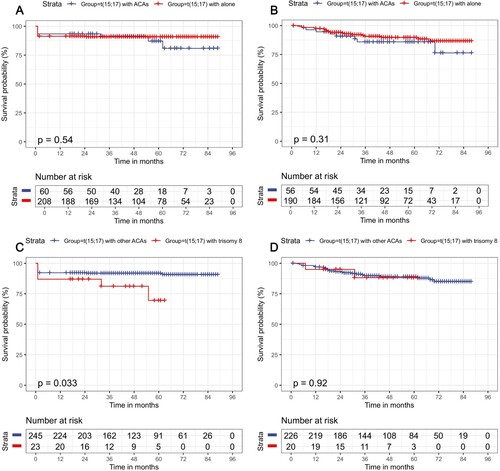
Figure 2. Survival outcomes for APL patients in the subgroup of age ≥60 years. (A) OS in the patients with aged ≥60 years subgroup; (B) DFS in those with aged ≥60 years subgroup.
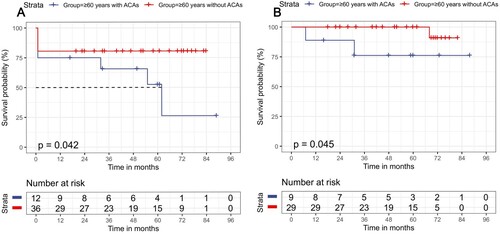
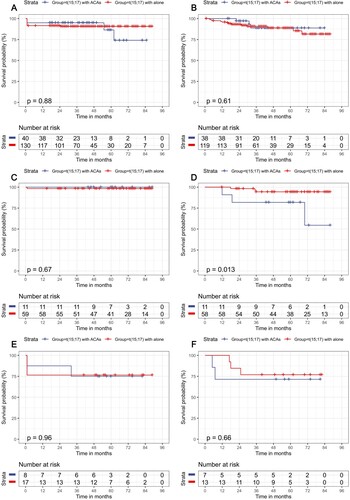
Figure 3. Survival outcomes for APL patients in various treatment subgroups according to the presence or absence of ACAs. (A) OS in the ATRA + ATO/RIF subgroup; (B) DFS in the ATRA + ATO/RIF subgroup group; (C) OS in the ATRA + ATO/RIF + CH subgroup; (D) DFS in the ATRA + ATO/RIF + CH subgroup; (E) OS in ATRA + CH subgroup; (F) DFS in ATRA + CH subgroup.