Figures & data
Table 1. General clinical data of 212 patients with DLBCL.
Figure 1. a. ROC curve of lactate dehydrogenase (LDH). b. ROC curve of albumin value (ALB).
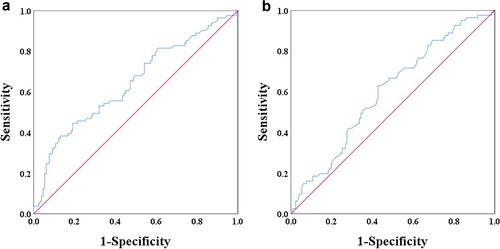
Figure 2. Kaplan–Meier survival analysis of LDH. Overall survival (a) and progression-free survival (b) according to LDH in DLBCL patients.
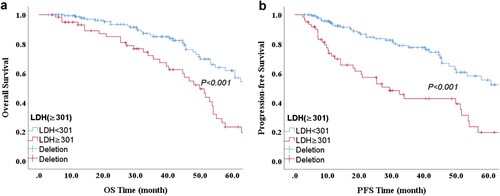
Figure 3. Kaplan–Meier survival analysis of ALB. Overall survival (a) and progression-free survival (b) according to ALB in DLBCL patients.
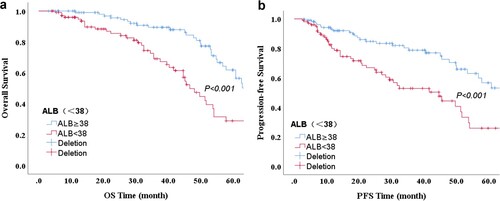
Figure 4. ROC curve of the LAR.
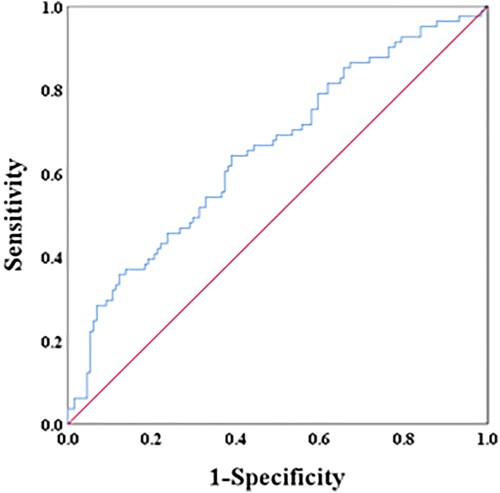
Figure 5. Kaplan–Meier survival analysis of LAR. Overall survival (a) and progression-free survival (b) according to the LAR in DLBCL patients.
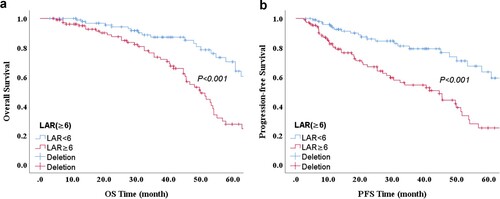
Table 2. Comparison of LDH and ALB in different clinicopathological features of DLBCL patients.
Table 3. Univariate analysis of prognosis.
Table 4. Multivariate analysis of prognosis.
Table 5. Multivariate analysis of prognosis.
Table 6. Clinical data analysis of ALB and LDH.
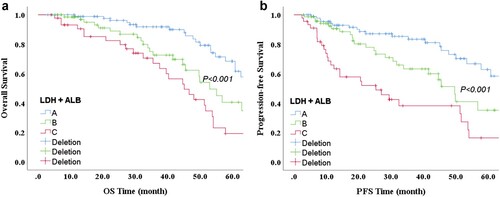
Figure 6. Kaplan–Meier survival analysis of LDH + ALB. Overall survival (a) and progression-free survival (b) according to LDH + ALB in DLBCL patients.