Figures & data
Table 1. Baseline characters between patients of FHR and FSR. Data are n (%) unless otherwise stated.
Figure 1. Flow chart of the study.
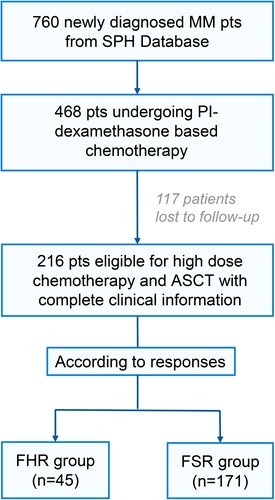
Table 2. Univariable and multivariate logistic regression analyses for FHR in MM patients.
Figure 2. PFS (A) and OS (B) of patients with and without amp (1q21). PFS (C) or OS (D) of patients with and without del (17p13).
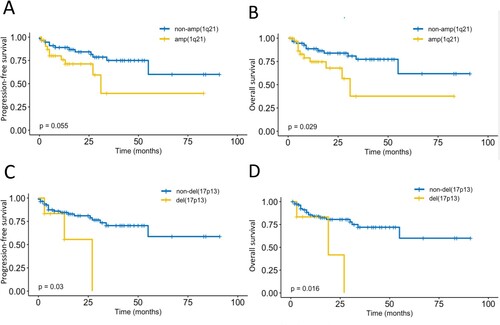
Figure 3. PFS (A) and OS (B) of patients with and without RI. PFS (C) or OS (D) of patients whether undertaking transplants with and without RI.
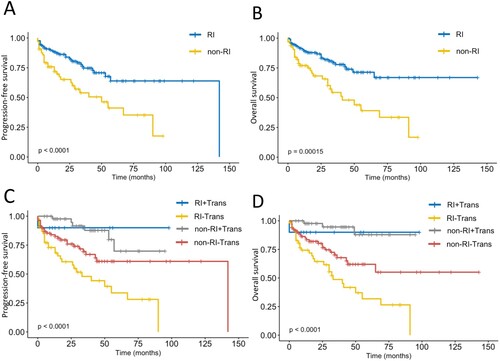
Figure 4. PFS (A) and OS (B) of patients with different levels of serum AST. PFS (C) or OS (D) of patients whether undertaking transplants with different serum AST levels.
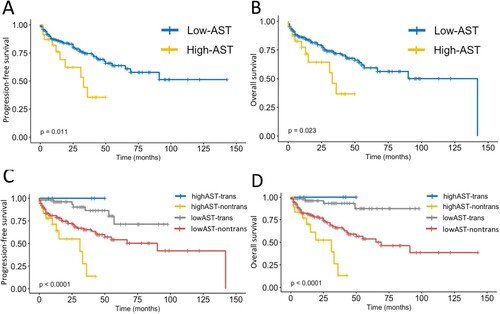
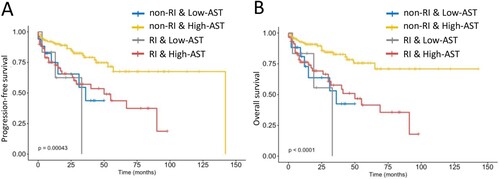
Figure 5. PFS (A) and OS (B) of patients with different serum Scr and AST levels.