
Figures & data
Figure 1. Flow chart. From 5211 ERGs, 85 candidate immune-related genes associated with the prognosis of patients with AML were identified from the TCGA dataset. LASSO analysis was used to construct a 5 immune-ERG-based signature. Survival and ROC curves were calculated to determine the prognostic value of the signature. A final risk model was constructed by combining genetic characteristics and clinical information.
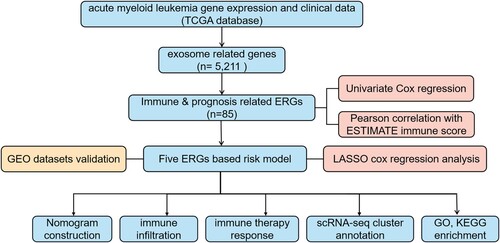
Figure 2. Construction of prognostic model for immune-exosome-related genes. (A) The LASSO coefficient spectrum was analyzed for 85 genes associated with exosome and immune. Each curve in the spectrum represents a specific gene. (B) A proportional hazards model was selected using cross-validation. (C) The overall survival (OS) of the TCGA-AML dataset was examined in relation to a prognostic model constructed using CD37, NUCB2, LSP1, MGST1, PLXNB1.
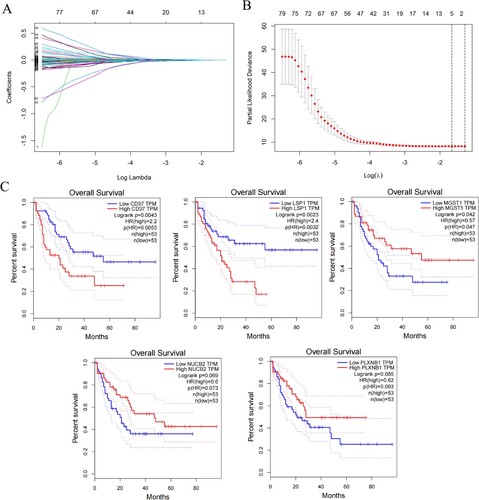
Figure 3. Development and validation of the immune-exosome-related genes prognostic model and predicting the outlook of AML patients. (A–C) Survival analysis was conducted for high- and low-risk groups in the TCGA dataset and GEO datasets GSE71014, and GSE106291. (D–F) The TCGA and GEO datasets were used to perform ROC curve analysis, which assessed the model’s predictive of performance over time. (G–I) In the distribution of expression profiles for 5 hub genes, the risk score, and survival status were assessed in the TCGA dataset (G) and GEO datasets (H, I), respectively.
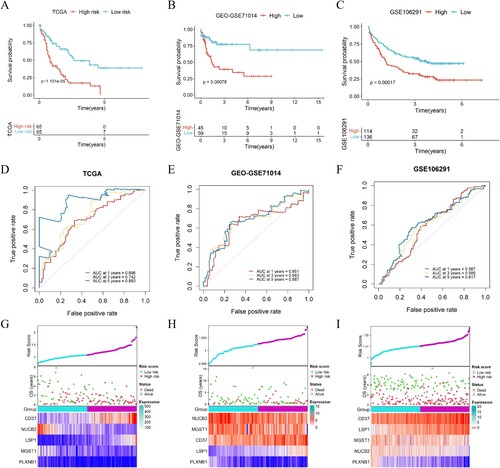
Figure 4. Analysis of the signature of immune-ERG, nomogram construction and evaluation. (A) Distribution of the percentage of different mutations between high- and low-risk groups. (B, C) Univariate (B) and multivariate (C) Cox regression analyses were conducted to investigate the connections between overall survival and different clinical factors, encompassing risk scores within the TCGA dataset. (D) Nomogram survival prediction models were developed to forecast the OS of patients with AML at 1-, 3-, and 5-years. (E) Calibration plots were generated to assess the accuracy of the nomogram in predicting survival at different time points.
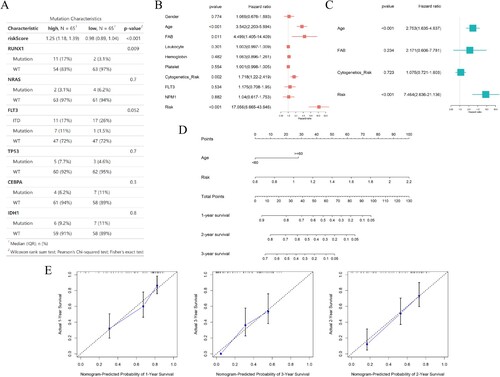
Figure 5. The correlation between the gene signature related to immune-exosomes and microenvironment in the TCGA dataset. (A–D) Notable variations were noted in the tumor purity (A), immune (B), estimate (C), and stroma scores (D) among the two risk categories. (E) Immune cell infiltration levels differed significantly between the high-risk and low-risk groups. (F) The variations in cellular composition between high- and low-risk groups. *p < 0.05, **p < 0.01, ***p < 0.001, ****p < 0.0001.
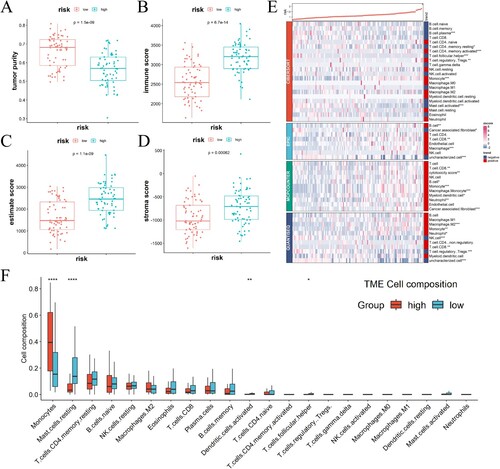
Figure 6. The relationship between scores indicating risk and the expression of immune checkpoint molecules. (A) In TCGA-AML, the expression of immune checkpoint molecules showed a positive correlation with the risk score. (B–I) A comparison was made between the two groups regarding the levels of immune checkpoint molecules in mRNA.
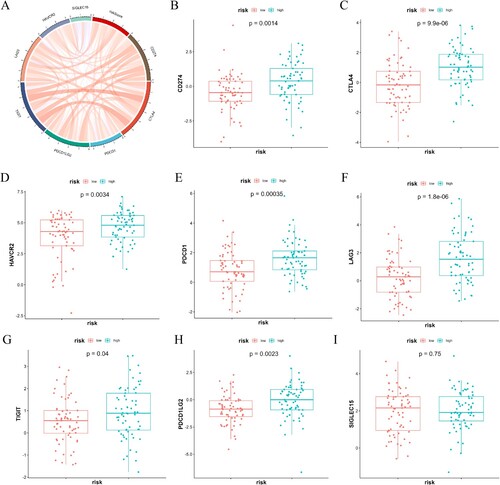
Figure 7. Tumor microenvironment analysis of clustering analysis by UMAP. (A–C) The UMAP plots of normal and maligant subsets. The UMAP plots of all subsets (A), normal subsets (B), and maligant subsets (C) show the expression levels of the specified signature genes. (D) The UMAP plots of AML samples show the expression levels of the specified signature genes. (E) Volin plots comparing the expression levels of five signature genes (CD37, LSP1, MGST1, NUCB2, PLXNB1) in the different types of cells.
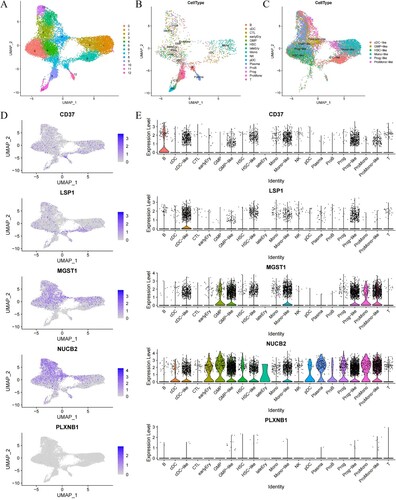
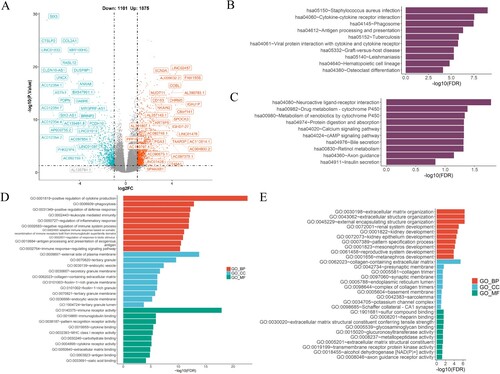
Figure 8. The enriched biological processes in risk model. (A) The volcano map depicted the differential expression of immune and exosome-related genes in the TCGA-AML cohort. (B, C) Enrichment pathways in the high-(B) and low-(C) risk groups were identified through KEGG analysis. (D, E) The GO enrichment analysis was performed to assess the enrichment of certain biological processes in the two groups. BP, biological processes; CC, cellular components; MF, molecular functions.
3. supplement files, 23.11.19.docx
Download MS Word (14.3 KB)Data availability statement
Datasets presented in this study are available in online repositories, and the article identifies the repository/repositories and accession number(s).