
Figures & data
Table 1. First-line therapy regimens for patients with PTCL, subset by subtype.
Figure 1. Consort diagram for screening PTCL patients.
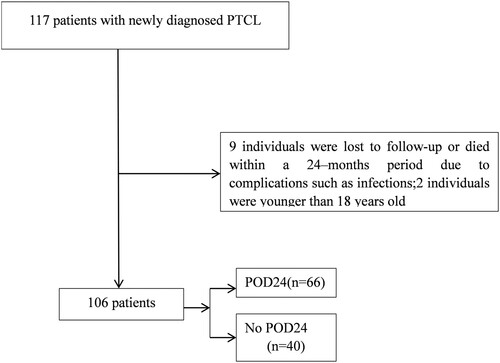
Table 2. Clinical characteristics of 106 patients with PTCL, all patients and subset by POD24 status.
Figure 2. Overall survival (OS) and Progression-Free-Survival (PFS). (A) OS of all PTCL patients. (B) PFS of all PTCL patients. (C) OS in the POD24 group and no POD24 group. In the no POD24 group, OS was significantly superior to the POD24 group (P < 0.0001). The 3-year OS rate in the POD24 group was 16.0%. (D) OS in the POD12 group and no POD12 group. In the no POD12 group, OS was significantly superior to the POD12 group (P < 0.0001). The 3-year OS rate in the POD12 group was 15.2%.
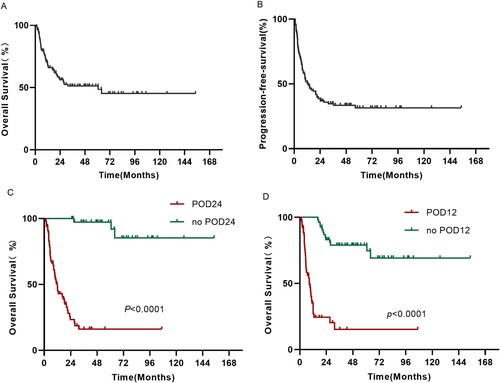
Figure 3. OS of PTCL subtypes. The 5-year OS rates in AITL, PTCL-NOS, ENKL, ALCL, and others was 37.4%, 37.7%, 60.5%, 81.8%, and 16.7%, respectively.
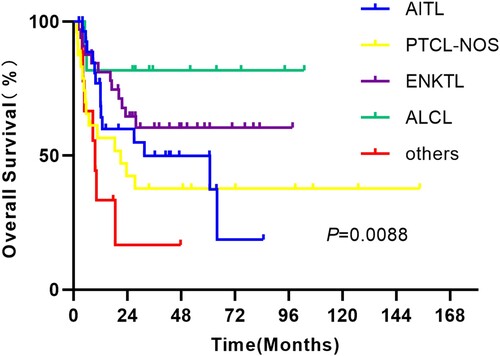
Table 3. Univariate and multivariate prognostic analysis of Overall Survival (OS) in all patients.
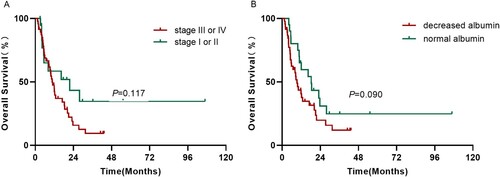
Figure 4. Prognostic factors for OS in the POD24 group. (A) OS of patients with different stages. (B) OS in ALB normal group and ALB reduced group.
Supplementary.docx
Download MS Word (85.2 KB)Data availability statement
The dataset used during the study is available from the corresponding author on a reasonable request.