
Figures & data
Table 1. Patient characteristics.
Figure 1. Legend: Gating strategy for T cell analysis: (A) helper CD4+ T cells as CD3+/CD4+ T cells; (B) IFNγ+, IL-4 + and IFNγ+/IL-4+ CD4+ T cells within CD4+ T cells; (C) IL-17a + CD4+ T cells within CD4+ T cells; (D) cytotoxic CD8+ T cells as CD3+/CD8+ T cells; (E) IFNγ+, IL-4 + and IFNγ+/IL-4+ CD8+ T cells within CD8+ T cells
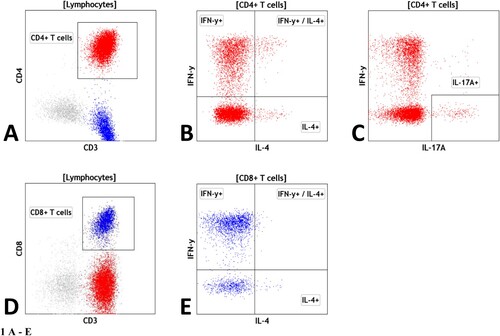
Table 2. Treatment discontinuation during follow-up: after 6 and 12 months, respectively.
Figure 2. Legend: The results of CD8+ T lymphocytes (%) stratified with respect to platelet count achieved at the 6-month time point, divided into two groups – PLT ≥ 100 and PLT < 100 × 109 /L.
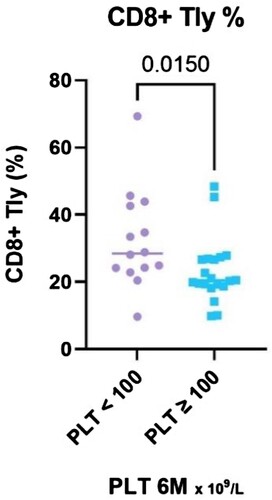
Figure 3. Legend: The results of IRI stratified with respect to platelet count achieved at the 6-month time point, divided into two groups – PLT ≥ 100 and PLT < 100 × 109 /L.
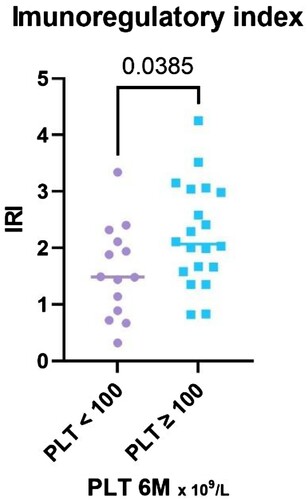
Figure 4. Legend: The results of antiplatelet autoantibodies (%) stratified with respect to platelet count achieved at the 6-month time point, divided into two groups – PLT ≥ 100 and PLT < 100 × 109 /L.
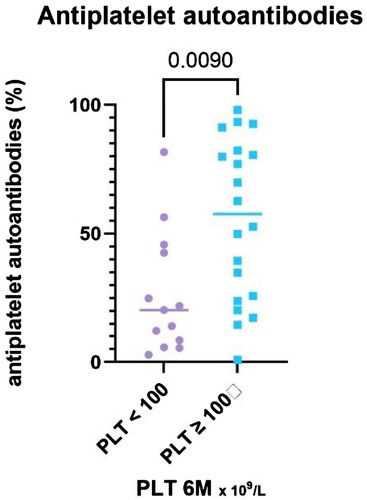
Figure 5. The results of CD8+ T lymphocytes (%) stratified with respect to platelet count achieved at the 12-month time point, divided into two groups – PLT ≥ 100 and PLT < 100 × 109 /L.
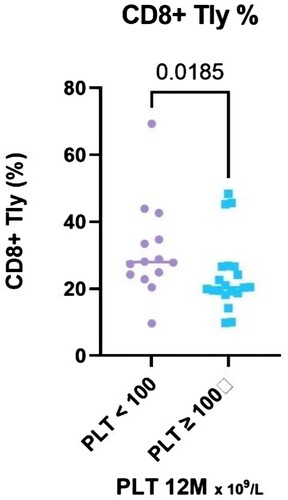
Figure 6. The results of CD8+/IL-4+/IFN-γ+ T lymphocytes (%) stratified with respect to platelet count achieved at the 12-month time point, divided into two groups – PLT ≥ 100 and PLT < 100 × 109 /L.
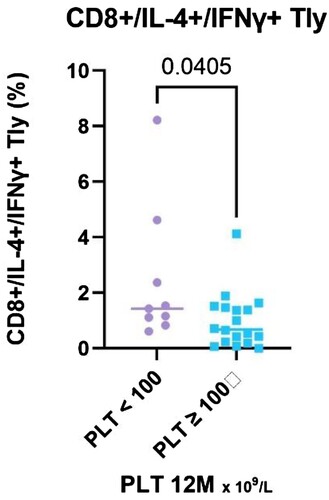
Figure 7. The results of IRI stratified with respect to platelet count achieved at the 12-month time point, divided into two groups – PLT ≥ 100 and PLT < 100 × 109 /L.
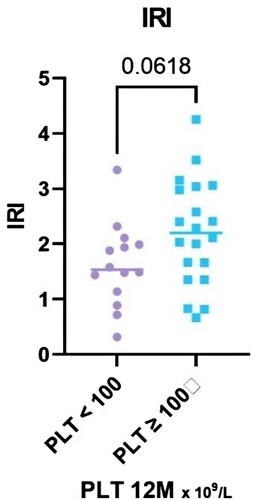
Figure 8. The results of antiplatelet autoantibodies (%) stratified with respect to platelet count achieved at the 12-month time point, divided into two groups – PLT ≥ 100 and PLT < 100 × 109 /L.
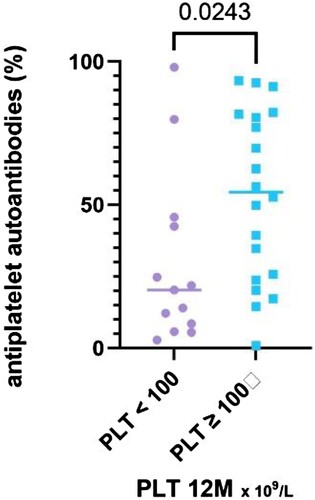
Table 3. Summary of statistical analysis of our data: Comparison with use of the T – test or Mann – Whitney test according to normality of the analyzed data comparing patients divided into two groups, responders (PLT ≥ 100 × 109 /L) and nonresponders (PLT < 100 × 109/L).
Figure 9. Receiver operating characteristic (ROC) curve comparing responders (PLT ≥ 100 × 109/L) and nonresponders (PLT < 100 × 109/L) at 12 months, comparing IRI (P = 0.06).
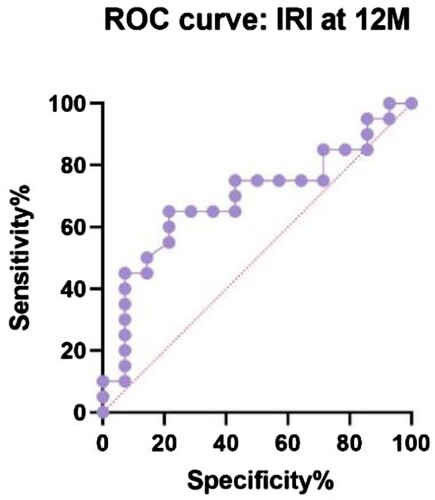
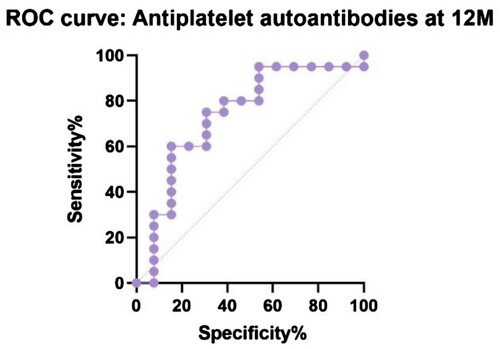
Figure 10. Receiver operating characteristic (ROC) curve comparing responders (PLT ≥ 100 × 109/L) and nonresponders (PLT < 100 × 109/L) at 12 months, comparing antiplatelet autoantibodies (%, P = 0.02).
Data availability
Data supporting the findings of this study are available from the corresponding author on a reasonable request.