Figures & data
Figure 1. Description of patient population – for assessment of renal response, IMWG renal response criteria were used.
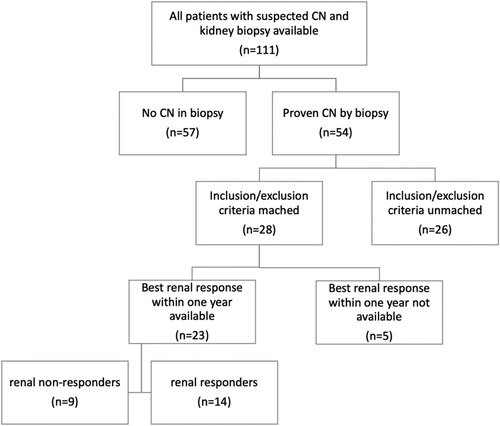
Table 1. Inclusion and exclusion criteria.
Figure 2. Leading symptoms on hospitalization day.
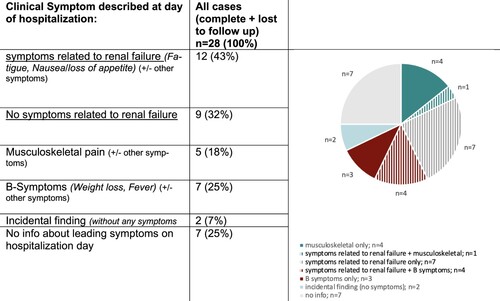
Figure 3. Renal response evaluation (IMWG renal response criteria) – Best renal response after one month, first therapy line and after one year.
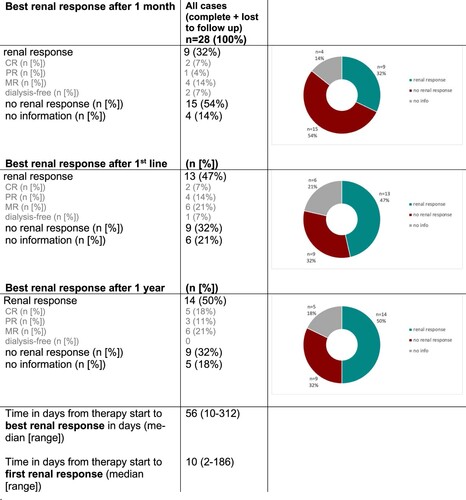
Table 2. Patients‘ characteristics – renal responder and renal non-responder (defined as renal response within one year).
Figure 4. A: Mean number of casts/mm2 (total, cortical, medulla) compared between renal responders (green) and renal non-responders (red); B: Cortical IF/TA score compared between patients with end-stage renal disease(grey) and no end stage renal disease (blue).
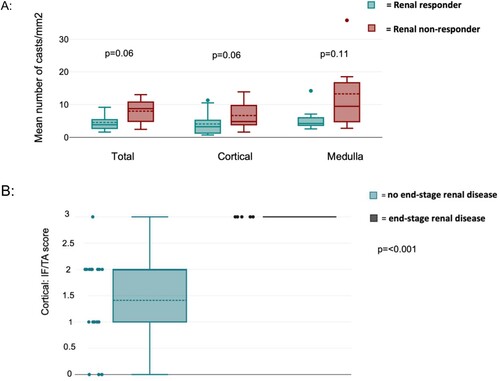
Table 3. Pathological findings (number of casts and IF/TA) defined as described in paragraph 2.3 and 2.4.
Figure 5. Percentage of hematologic responders in the group of renal responders and non-responders.
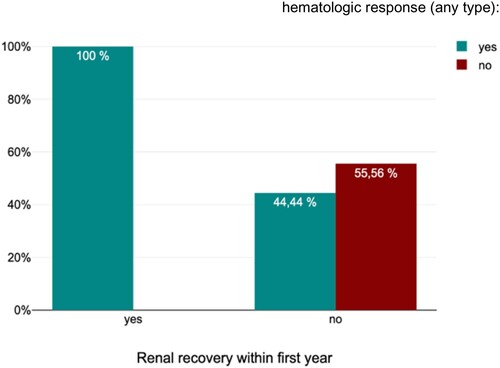
Table 4. Hematologic response – renal responder and renal non-responder.
Figure 6. Therapy and dialysis – renal responders and renal non-responders. * Dialysis dependency > 3 months. ** PIs used were Bortezomib (n = 22) and Carfilzomib (n = 1)
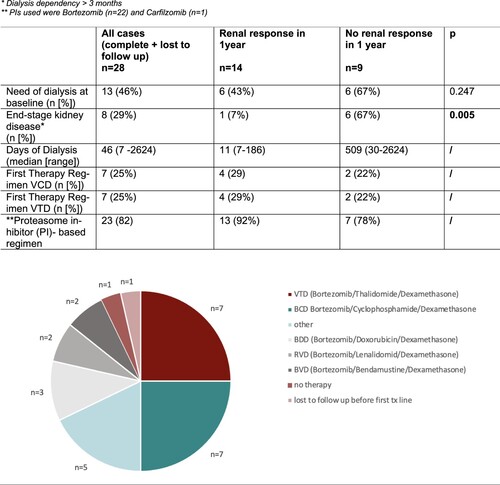
Figure 7. Time period (in days) from initial presentation (A) to CN-diagnosis (B) to therapy start (T).
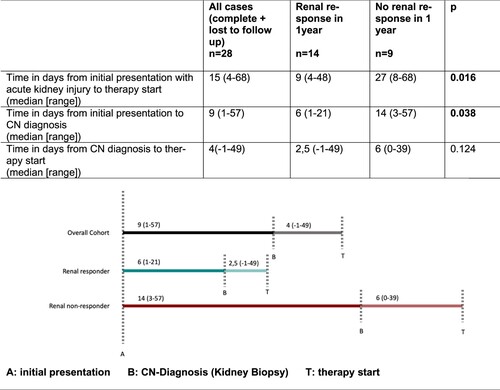
Figure 8. Survival – complete cohort.
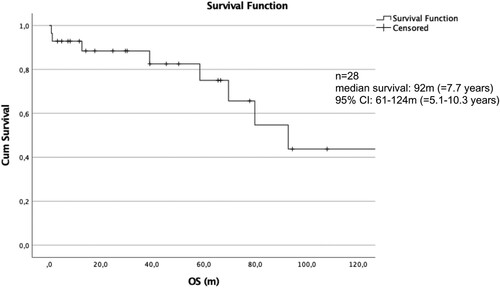
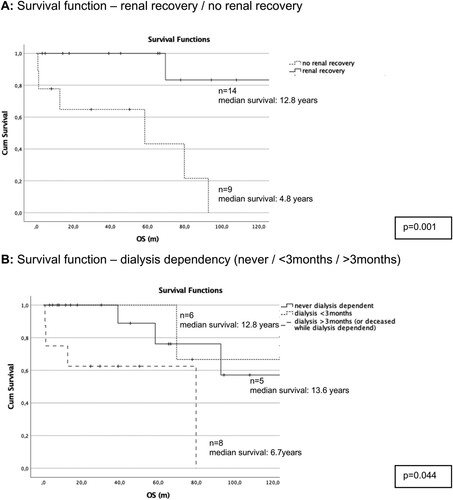
Figure 9. Survival analysis: A: renal response / B: dialysis dependency.