
Figures & data
Figure 1. Flowchart of the study. GSE, GEO Series; DEGs, differentially expressed genes; WGCNA, weighted gene co-expression network analysis; GO, gene ontology; KEGG, Kyoto Encyclopedia of Genes and Genomes; ROC curve, receiver operator characteristic curve.
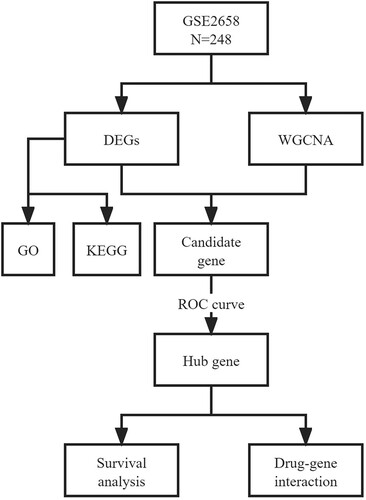
Figure 2. Screening of DEGs. a Volcano plot with cutoff criteria set to adjusted P-value < 0.05 and |log2FC| > 1. Red triangles indicate Up-regulated genes, and blue triangles indicate Down-regulated genes. b Heatmap of the 55 DEGs according to the values of |log2FC|. DEGs, differentially expressed genes; FC, fold change.
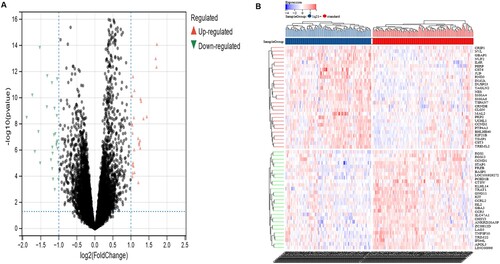
Figure 3. KEGG pathway and GO analysis of DEGs. The bubble diagrams show the top 10 functional and results with significant differences. a KEGG of up-regulated DEGs. b GO of up-regulated DEGs. c KEGG of down-regulated DEGs. d GO of down-regulated DEGs. GO, Gene Ontology; KEGG, Kyoto Encyclopedia of Genes and Genomes; DEGs, differentially expressed genes.
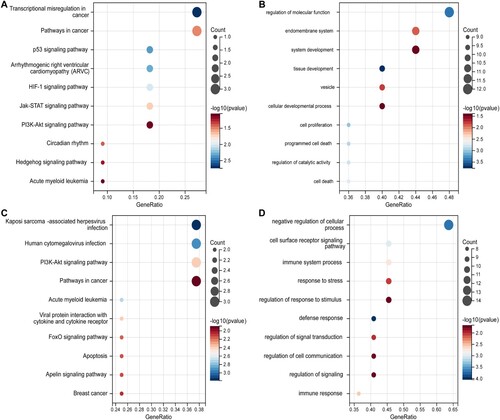
Figure 4. The process of WGCNA. a Sample clustering with the trait heatmap. b the left panel shows the scale-free fit index (y-axis) as a function of the soft thresholding power (x-axis); the right panel displays the mean connectivity (degree, y-axis) as a function of the soft-thresholding power (x-axis); c Clustering dendrograms for the 10275 genes with dissimilarity based on the topological overlap together with the assigned module colors; eighteen co-expression modules were constructed with various colors. d Module-trait relationships; each row corresponds to a module eigengene, each column corresponds to a trait, and each cell consists of the corresponding correlation and P-value, which are color-coded by correlated according to the color legend. e The heatmap shows the eigengene adjacency. f Scatterplot of 475 genes in the black module; the correlation and P-value are in the upper left corner. WGCNA, weighted gene co-expression network analysis.
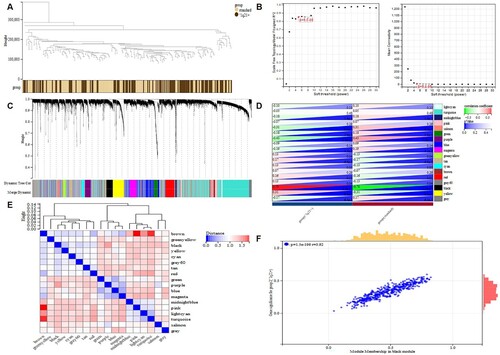
Figure 5. a ROC curves of candidate genes. b Survival curves of hub genes.
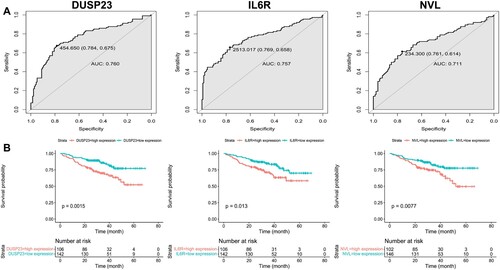
Table 1. The known interaction-drugs targeted to hub genes.
Supplemental Material
Download Zip (2 MB)Data availability statement
The datasets GSE2658 presented in this study can be found in [GEO database] [https://www.ncbi.nlm.nih.gov/geo/query/acc.cgi?acc = GSE2658].