Figures & data
Figure 1. The pancytopenia of AA mice model and Effects of Dioscin in mice.(A) The probability of survavial (n = 3). (B) The molecular structure of dioscin (n = 3). (C) Effects of Dioscin on pancytopenia in AA model mouse. Data were expressed as mean ± SD (n = 3). (D) Bone marrow biopsies were stained with HE in the Control, AA and Dioscin groups (200X) (n = 4). (E) IL-10, IL-35 and TGF-β in the Control, AA and Dioscin groups (n = 3). (a. Control group. b. AA group. c. AA + Dioscin group. **P<0.01 vs. control group. ##P<0.01 vs. AA group).
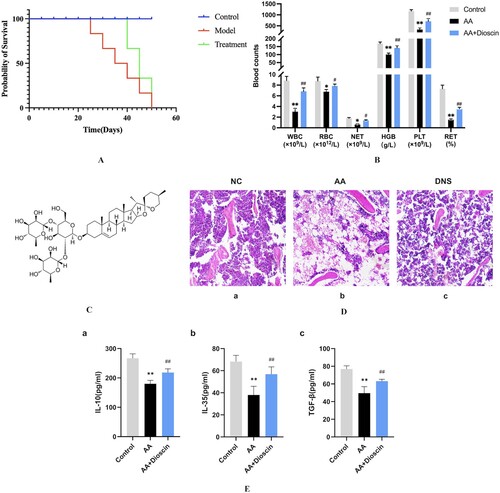
Table 1. Peripheral blood cell count in mice (n = 10).
Table 2. Weight and BMNC in mice (n = 10).
Figure 2. Effects of Dioscin on Foxp3 in splenic lymphocytes of AA mice. (A) Purification of CD4+ CD25+ Tregs (n = 3). (B) The proliferation of Tregs (n = 3). (C) The cell viability of Tregs treated with Dioscin at 24 h, 48 and 72 h (n = 3). Data were mean ± SD (*P < 0.05 vs. NC group, #P < 0.05 vs. AA model group, **P<0.01 vs. control group. ##P<0.01 vs. AA group).
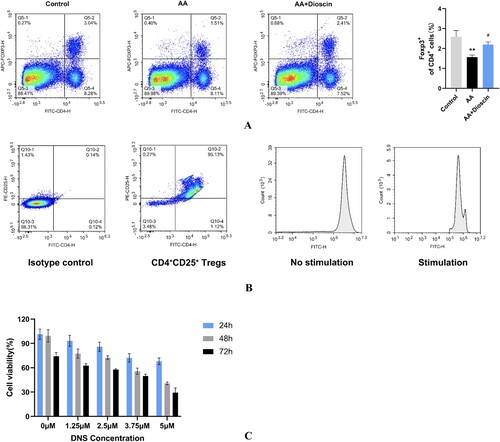
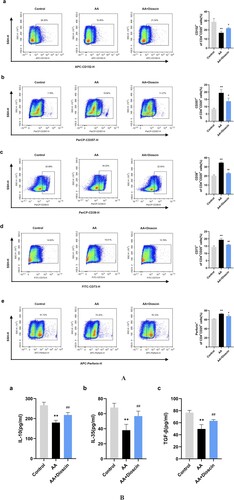
Figure 3. Effects of Dioscin on surface molecules of Tregs. (A): (a) The proportion of CD152 on Tregs among groups (n = 3). (b) The proportion of CD357 on Tregs among groups (n = 3). (c) The proportion of CD39 on Tregs among groups (n = 3). (d) The proportion of CD73 on Tregs among groups (n = 3). (e) The proportion of perforin on Tregs among groups (n = 3). (B) Level of IL-10, IL-35 and TGF-β in the Control, AA and Dioscin groups secreted by Tregs (n = 3). Data were mean ± SD (*P < 0.05 vs. NC group, #P < 0.05 vs. AA model group, **P<0.01 vs. control group. ##P<0.01 vs. AA group).