Figures & data
Figure 1. Flow chart of participant selection.
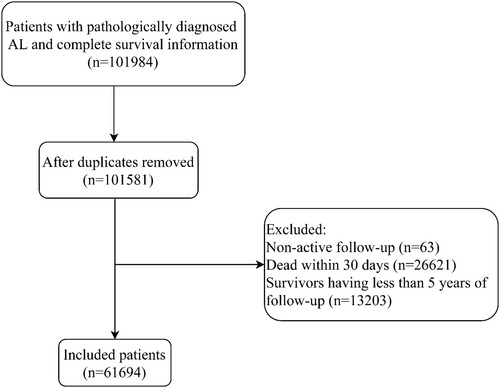
Table 1. Characteristics of the included AL patients.
Figure 2. Incidence rate of AL, ALL, AML and AUL in children and adolescents and adults. (A) incidence in children and adolescents; (B) incidence in adults. AL, acute leukemia; ALL, acute lymphoblastic leukemia; AML, acute myeloid leukemia; AUL, acute undifferentiated leukemia; APC, annual percent changes.
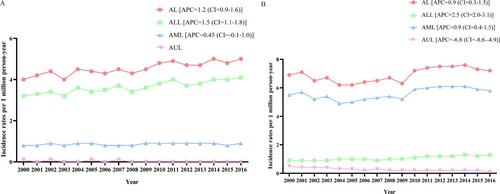
Figure 3. OS of children and adolescents and adults with AL. OS, overall survival; AL, acute leukemia.
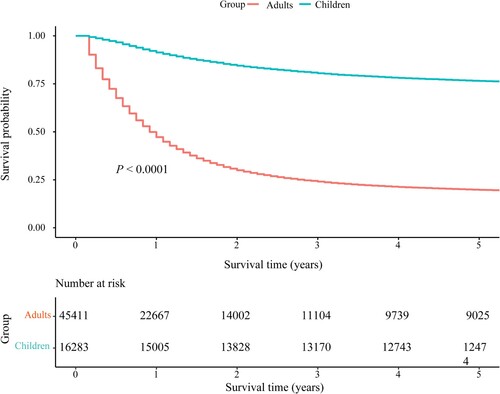
Figure 4. OS of children and adolescents. (A) OS of children and adolescents with ALL at different ages; (B) OS of children and adolescents with AML at different ages; (C) OS of children and adolescents with AUL at different ages. OS, overall survival; ALL, acute lymphoblastic leukemia; AML, acute myeloid leukemia; AUL, acute undifferentiated leukemia.
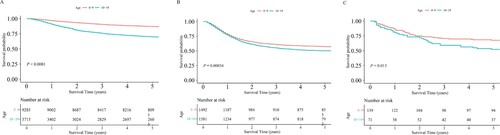
Figure 5. OS of adults. (A) OS of adults with ALL at different ages; (B) OS of adults with AML at different ages; (C) OS of adults with AUL at different ages. OS, overall survival; ALL, acute lymphoblastic leukemia; AML, acute myeloid leukemia; AUL, acute undifferentiated leukemia.
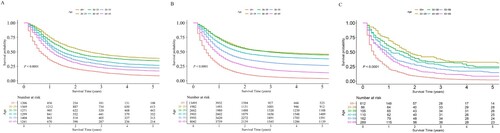
Table 2. Prognostic factors for OS in children and adolescents with ALL.
Table 3. Prognostic factors for OS in children and adolescents with AML.
Table 4. Prognostic factors for OS in children and adolescents with AUL.
Table 5. Prognostic factors for OS in adults with ALL.
Table 6. Prognostic factors for OS in adults with AML.
Table 7. Prognostic factors for OS in adults with AUL.
Table 8. Prognostic factors for CSS in children and adolescents with ALL.
Table 9. Prognostic factors for CSS in children and adolescents with AML.
Table 10. Prognostic factors for CSS in children and adolescents with AUL.
Table 11. Prognostic factors for CSS in adults with ALL.
Table 12. Prognostic factors for CSS in adults with AML.
Table 13. Prognostic factors for CSS in adults with AUL.
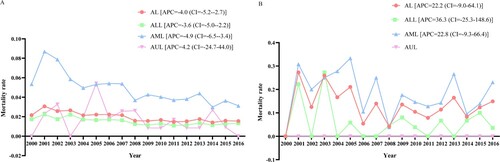
Figure 6. Mortality rate of children and adolescents with AL, ALL, AML and AUL. (A) Mortality when AL was the first primary malignancy; (B) mortality when AL was not the first primary malignancy. AL, acute leukemia; ALL, acute lymphoblastic leukemia; AML, acute myeloid leukemia; AUL, acute undifferentiated leukemia; APC, annual percent changes.