
Figures & data
Table 1. Characteristics of selected polymorphisms involved in the CTLA-4 rs231775 and TIM-3 rs105157460.
Table 2. Association between AML and CTLA-4 rs10515746 SNP.
Table 3. Association between TIM-3 rs10515746 SNP with AML.
Table 4. Correlation between CTLA-4 rs231775 and TIM-3 rs10515746 SNPs with AML after gender stratification.
Table 5. Correlation between CTLA-4 rs231775 and TIM-3 rs10515746 SNPs with AML after age stratification.
Figure 1. A, Expression of CTLA-4 in blood of AML patients (red) and normal blood (black). Each bar indicates the average level of expression of CTLA-4. Data were obtained from the GEPIA database were extracted (http://gepia.cancer-pku.cn). B: Kaplan-Meier analysis obtained plot from in the UALCAN database (http://ualcan.path.uab.edu/).
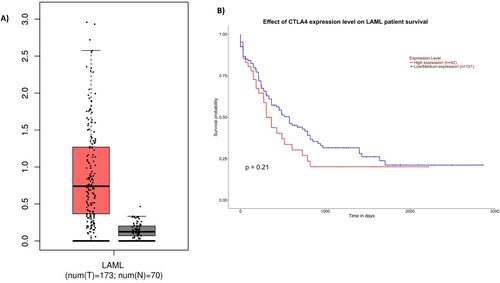
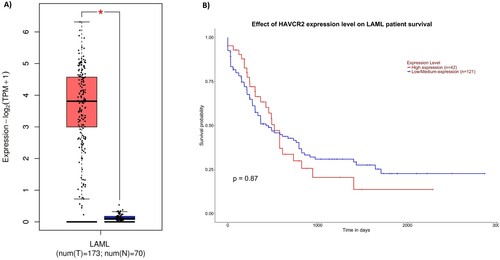
Figure 2. A: Expression of TIM-3 (HAVCR2) in blood of AML patients (red) and normal blood (black). Each bar indicates the average level of expression of TIM-3. Data were obtained from the GEPIA database were extracted (http://gepia.cancer-pku.cn). B: Kaplan-Meier analysis obtained plot of TIM-3 obtained from in the UALCAN database (http://ualcan.path.uab.edu/).
Data availability statement
All data relevant to the study are included in the article.