
Figures & data
Table 1. Patients’ characteristics.
Figure 1. Number of adverse events recorded in the overall population.
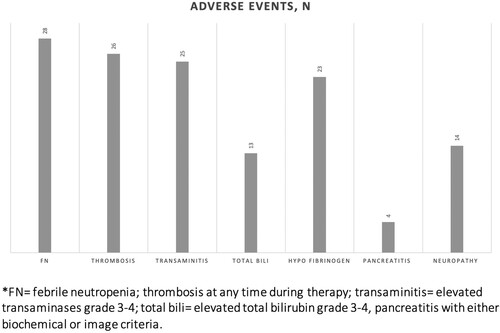
Table 2. Adverse event rates at any phase during therapy.
Figure 2. Comparison of adverse event rates between patients who received EC-ASP vs PEG-ASP. This figure presents a side-by-side comparison of the adverse events elucidating a comparison between the two formulations.
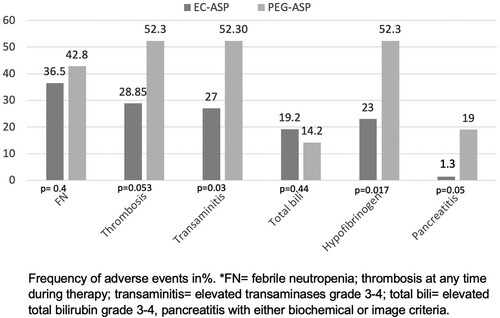
Figure 3. Overall survival and leukemia-free survival analysis.
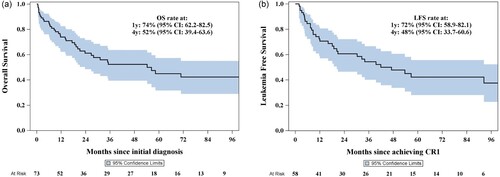
Figure 4. (a) Overall survival (OS) by age group. Stratification by age, with a specific focus on patients aged 70 years or older, who had worse OS rates (p = 0.0134), indicating the impact of age on treatment outcomes. (b) Overall survival (OS) by white blood cell count (WBC). Categorizing according to white blood cell count, revealed that patients with a WBC count greater than 30 x 109/L exhibited poorer OS (p = 0.0069), underscoring the prognostic value of WBC count. (c) Overall survival by history of previous malignancy. Patients with a history of malignancy had poorer OS (p = 0.0353), which highlights the influence of pre-existing conditions on treatment efficacy. (d) Overall survival by measurable residual Disease (MRD) status post-induction. This figure evaluates overall survival rates based on MRD status after induction therapy, demonstrating that MRD-positive patients had significantly poorer OS (p = 0.0056), emphasizing the prognostic importance of MRD status.
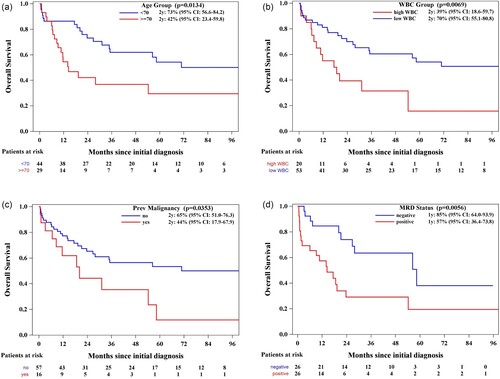
Figure 5. Overall survival and leukemia-free survival by type of asparaginase used, noting no significant differences in outcomes.
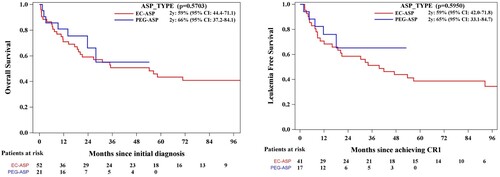
Table 3. Univariate and multivariable overall survival analysis.