Figures & data
Figure 1. Elevated expression of LSP1 in AML correlates with poor survival. A. dot plot of the expression of LSP1 in tumor samples and paired normal tissues, data was from GEPIA 2. B. dot plot showing the expression of LSP1 in AML patients and normal cells. C. immunoblotting of LSP1 and β-actin in myeloid cells from 5 AML patients and 5 healthy donors. D. Kaplan-Meier plot of overall survival in AML patients based on the expression of LSP1. Data was from GEPIA 2. E. Kaplan-Meier plot of overall survival in AML patients based on the expression of LSP1. Data was from UALCAN. F. Histogram showing the relationship of LSP1 and cytogenetic risk in AML. G. Histogram showing the expression of LSP1 in AML with or without Ras activation, PML/RAR fusion and FLT3 mutation.
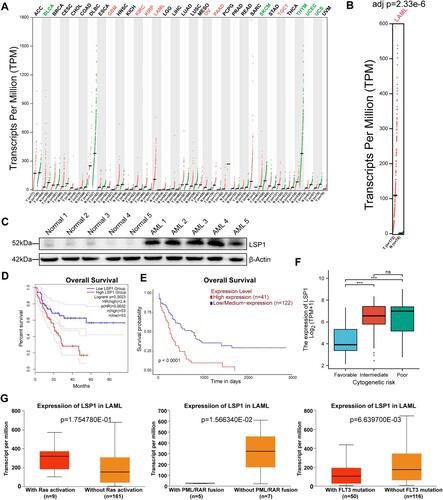
Table 1. Clinical factors and LSP1 expression from AML patients.
Figure 2. Knock-out of LSP1 inhibited KSR/ERK activation and proliferation in AML cell lines. A. Immunoblotting verifying the knock-out efficiency of LSP1 in HL-60 and MOLM-14 cell lines. B. Immunoblotting of KSR/ERK activation in the control and shLSP1 groups. C. Histogram showing the relative expression of p-KSR and p-ERK from immunoblotting. D. Diagram of cell proliferation rate for the indicated HL-60 groups. E. Diagram of cell proliferation rate for the indicated MOLM-14 groups. F. Percentage of cell cycle in the control and shLSP1 groups. G. Histogram of DCFH-DA intensity in the control and shLSP1 groups.
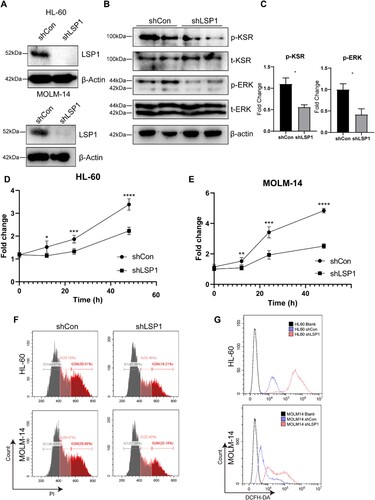
Figure 3. Knock-out of LSP1 restricts cell migration and homing in AML cell lines. A. line graph showing cell locomotion distance of HL-60 cells with or without LSP1 knock-out. B. Histogram showing the migration distance of HL-60 cells with or without LSP1 knock-out after 2 h. C. Histogram showing cell number counts of migration. D. Histogram showing migration distance of MOLM-14 with or without LSP1 knock-out after 2 h. E. Histogram showing cell number counts of migration. F. Diagram of percentage of HL-60 cells in transplanted mice. G. Histogram showing percentage of HL-60 cells in transplanted mice. H. Kaplan-Meier plot depicting the survival of mice transplanted with shCon HL-60 or shLSP1 HL-60 cells. I. H&E staining pictures of BM from mice transplanted with shCon or shLSP1 HL60 cells. J. Morphologic pictures of the spleen from mice transplanted with shCon or shLSP1 HL60 cells. K. Immunoblotting of KSR/ERK activation in BM cells from control and shLSP1 HL60-transplanted mice.
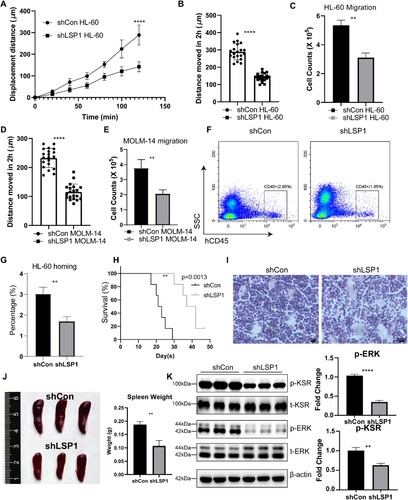
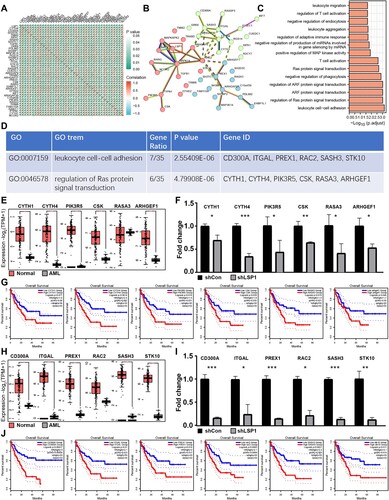
Figure 4. LSP1-related gene sets exhibit diagnostic and prognostic value in AML. A. Heatmap showing the correlated expression of 40 genes in AML patients. B. STRING assay of protein interaction among LSP1 and the co-expressed 40 genes. C. Histogram showing the GO enrichment of the co-expressed 40 genes. D. Chart of selected gene sets that associated with LSP1. E. Histogram of Ras signaling-related gene expression in AML. F. Histogram showing the relative mRNA levels of the indicated genes in shCon and shLSP1 HL-60 cells. G. Kaplan-Meier plot depicting the overall survival of AML patients, with patients divided according to these Ras signaling-related genes. H. Histogram of cell adhesion-related gene expression in AML. I. Histogram displaying the relative mRNA levels of the indicated genes in shCon and shLSP1 HL-60 cells. J. Kaplan-Meier plot depicting the overall survival of AML patients, with patients divided according to these cell adhesion-related genes.