
Figures & data
Table 1. Clinical characteristics of MM patients.
Figure 1. PHF19 expression was aberrantly high and declined post induction treatment in MM patients.
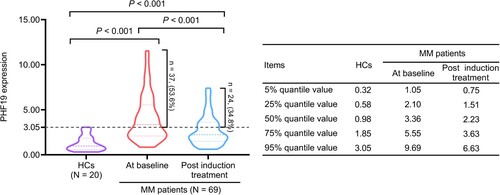
Table 2. Correlation of PHF19 expression with clinical characteristics of MM patients.
Figure 2. PHF19 expression at baseline and post induction treatment were negatively linked with CR and ORR in MM patients. Correlation of PHF19 expression at baseline, post induction treatment, and its change with treatment regimens (A), CR (B), and ORR (C). PHF19 expression change equaled to PHF19 expression post induction treatment minus its expression at baseline.
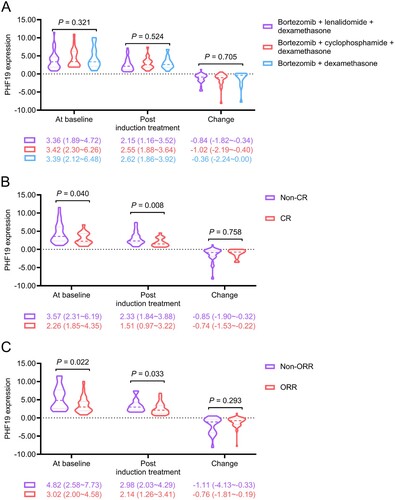
Figure 3. Abnormal PHF19 expression at baseline and post induction treatment were associated with shorter EFS in MM patients. The accumulating EFS rates (A). Linkage of abnormal PHF19 expression at baseline (B) and post induction treatment (C) with EFS.
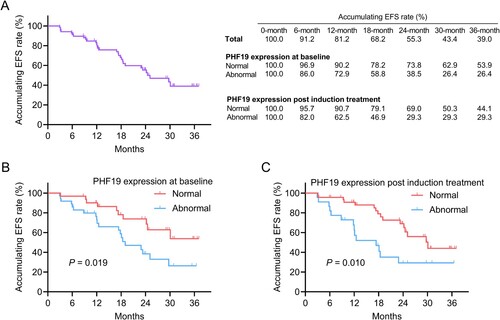
Figure 4. Abnormal PHF19 expression at baseline and post induction treatment were associated with shorter OS in MM patients. The accumulating OS rates (A). Linkage of abnormal PHF19 expression at baseline (B) and post induction treatment (C) with OS.
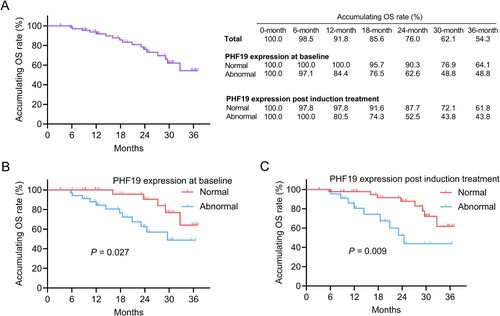
Table 3. Cox regression model of EFS.
Table 4. Cox regression model of OS.