
Figures & data
Table 1. Characteristics of study subjects included in the study.
Figure 1. Scatter plots showing RBCLS for three groups. The mean RBCLS was found to be shorter in TTP patients (n = 23) compared to ITP patients accompanied by anemia (n = 32). Furthermore, the mean RBCLS was significantly shorter in patients with ITP accompanied by anemia compared to healthy controls (n = 30). Among ITP patients, those without gastrointestinal (GI) bleeding (n = 20) exhibited higher RBCLS values than those with GI bleeding (n = 12). Mean and SD are shown for each group. The long horizontal dashed line indicates baseline normal RBCLS. RBCLS: red blood cell lifespan, HC: healthy controls, ITP: primary immune thrombocytopenia, TTP: thrombotic thrombocytopenic purpura.
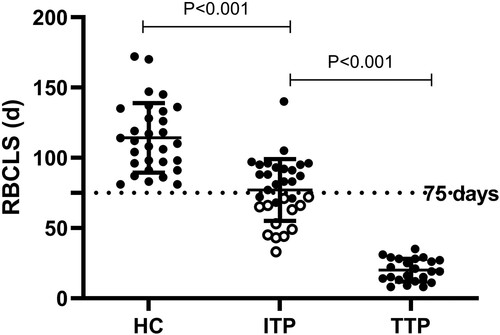
Figure 2. Correlation between RBCLS and clinical laboratory indices in 23 TTP patients. A: RBCLS versus reticulocyte percentage; B: RBCLS versus lactic dehydrogenase level. RBCLS: red blood cell lifespan, TTP: thrombotic thrombocytopenic purpura.
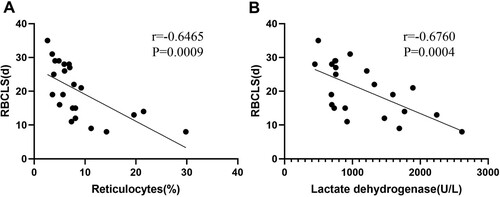
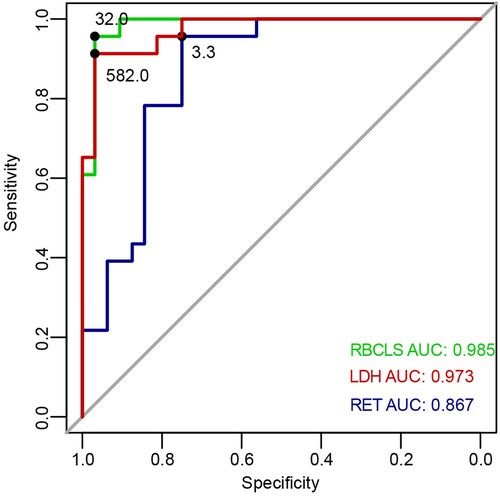
Figure 3. ROC curve for predicting TTP using RBCLS, LDH and RET. ROC: receiver operating characteristic, TTP: thrombotic thrombocytopenic purpura, LDH: lactate dehydrogenase, RET: reticulocyte.
Data availability statement
The datasets analyzed in this study can be requested from the corresponding author upon a reasonable request.