Figures & data
Figure 1. The expression of DEGs based on GEO database datasets. (A) Heatmap showed 793 DEGs, including 285 upregulated genes and 508 down-regulated genes and (B) Violin diagrams, the abscissa-above red dots represent upregulated genes in MM patients, the abscissa-below red dots represent down-regulated genes in MM patients and the black dots represent genes with no significant differences. (C) Correlation plot of 40 DEGs. The positive correlation was marked with red and negative correlation was marked with blue. The size of circle represents the absolute value of correlation coefficients.
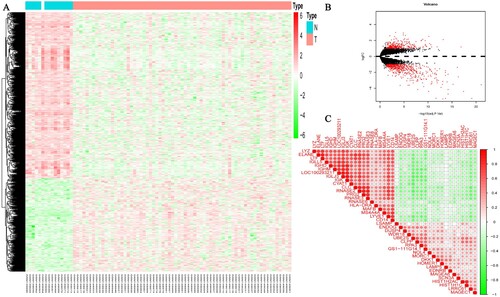
Figure 2. The GO, KEGG enrichment and GSEA analyses using the 793 DEGs. (A) GO functional analysis shows enriched items in the DEGs. (B) KEGG analysis shows the enriched items in the DEGs. BP, biological process; CC, cellular component; MF, molecular function. (C) GSEA plot of genes involved in cell cycle, DNA replication, homologous recombination, P53 signaling pathway, RNA degradation, and spliceosome signaling pathway.
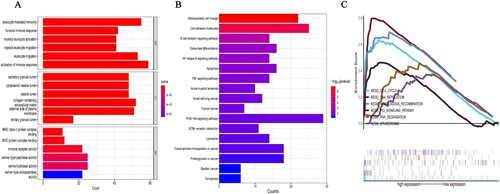
Figure 3. The protein–protein interaction (PPI) network and 4 hub gene interaction network analyzed using Cytoscape software (A) PPI network. The interaction score with the highest confidence (0.9) was chosen as the minimum required interaction score. (B) The sub-net scored four and showed interactions between HIST1H2AC, HIST1H2BH, CCND1 and TCF7L2.
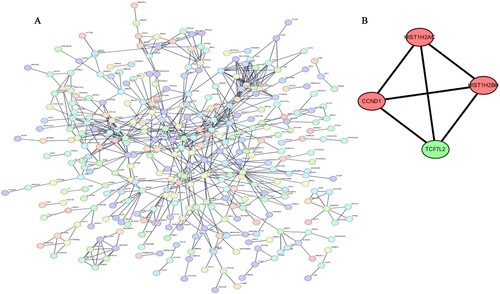
Figure 4. (A) Multivariate Cox regression analysis according to HIST1H2BH expression levels, patient age, gender and disease stage based on DEGs in the TCGA dataset. (B) HIST1H2BH expression levels on different clinical stage based on TCGA dataset.
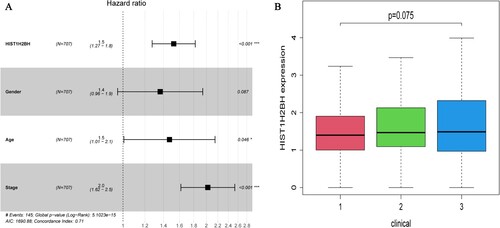
Figure 5. The expression of HIST1H2BH increased in MM samples and siHIST1H2BH can decrease the proliforation of MM cell lines. Relative HIST1H2BH expression was determined in MM samples and healthy people by quantitative real-time PCR analysis. (B and C) Cell growth of siHIST1H2BH and siControl transfected U266 and RPMI8226 cell lines was analyzed by CCK-8 assays.
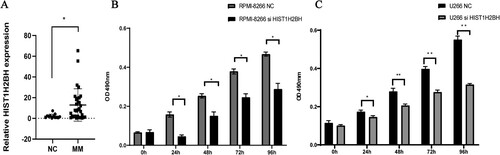
Table 1. Sample clinical features of MM.
Table 2. Correlation between HIST1H2BH expression and clinical characteristics of MM patients.
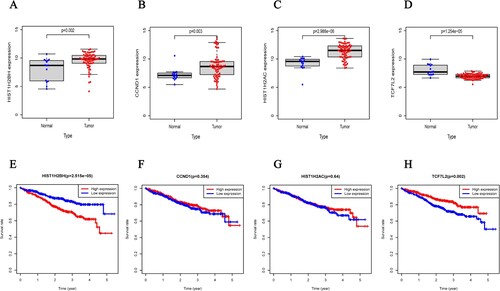
Figure 6. The expression of four different genes in tumor and normal tissue from TCGA cohort (A.HIST1H2BH gene, B.CCND1 gene, C.HIST1H2AC gene, D.TCF7L2 gene) and Kaplan-Meier curves for the OS of patients in the high-risk group and low-risk group in the TCGA cohort for four genes (E.HIST1H2BH gene, F.CCND1 gene, G.HIST1H2AC gene, H.TCF7L2 gene).