
Figures & data
Table 1. Sequences of the primers for quantitative PCR.
Figure 1. Effect of honokiol at different concentrations on cell viability of T-ALL cell lines. Cell viability of DEX-resistant CEM-C1 cells (A) and DEX – sensitive CEM-C7 cells (B) exposed to honokiol at different concentrations (0–20 µM) for 24, 48, and 72 h. Data represent mean ± SD (n = 3), *p < 0.05.
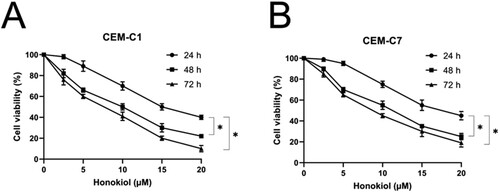
Table 2. IC50 values in CEM-C1 and CEM-C7 cells after 24, 48, and 72 h-treatment by honokiol.
Figure 2. Effect of honokiol at different concentrations on cell cycle of T-ALL cell lines. DEX-resistant CEM-C1 cells and DEX – sensitive CEM-C7 cells were treated with honokiol at different concentrations (0–20 µM) for 48 h. Cell cycle distribution (A) was determined using flow cytometry and the expressions of cell cycle-regulated proteins (B) were measured by western blot. Data represent mean ± SD (n = 3), *p < 0.05 as compared to the control group.
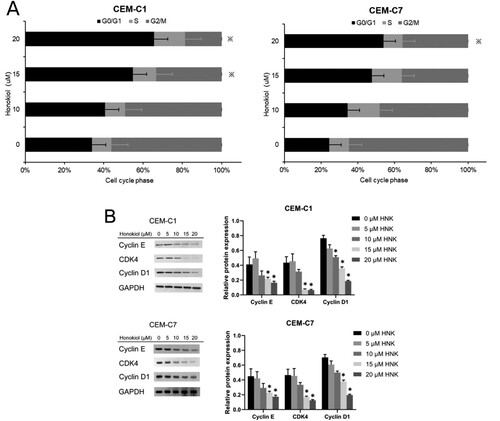
Figure 3. Effect of honokiol at different concentrations on cell apoptosis of T-ALL cell lines. DEX-resistant CEM-C1 cells and DEX – sensitive CEM-C7 cells were treated with honokiol at different concentrations (0–20 µM) for 48 h. Cell apoptosis (A) and the rate of apoptosis (B) was measured using flow cytometry and the expressions of pro – and anti-apoptotic proteins (C) were measured by western blot. Data represent mean ± SD (n = 3), *p < 0.05 as compared to the control group.
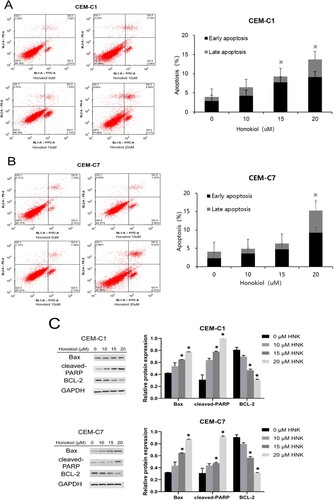
Figure 4. Acridine orange staining for the detection of autophagy in DEX-resistant CEM-C1 cells and DEX – sensitive CEM-C7 cells. Maenification.x400.Viable cells’ nuclei stain green due to permeability of only acridine orange whereas, apoptotic cells appear red/orange due to co-staining of both the fluorescent dyes.
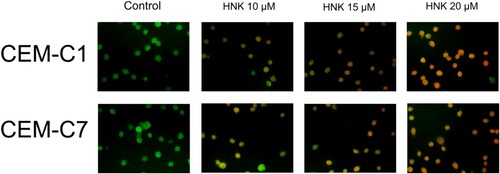
Figure 5. Effect of honokiol at different concentrations on cell autophagy of T-ALL cell lines. The expression level of the autophagy-related protein LC3-II (A) and LC3 mRNA (B) in DEX-resistant CEM-C1 cells and DEX – sensitive CEM-C7 cells upon the treatment of honokiol at different concentrations (0–20 µM) were determined using western blot and RT-qPCR, respectively. Data represent mean ± SD (n = 3), *p < 0.05 as compared to the control group.
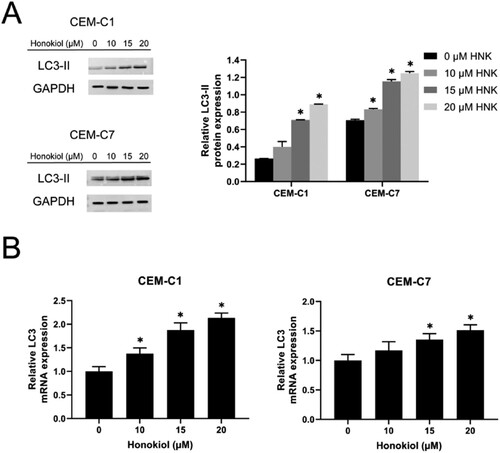
Figure 6. Effect of dexamethasone at different concentrations on cell viability of T-ALL cell lines. Cell viability of DEX-resistant CEM-C1 cells (A) and DEX – sensitive CEM-C7 cells (B) exposed to dexamethasone at different concentrations (0–400 µM) with or without 1.5 µM honokiol for 48 h. Data represent mean ± SD (n = 3), *p < 0.05.
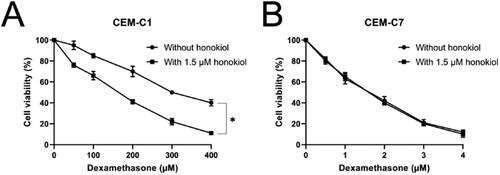
Table 3. IC50 values in CEM-C1 and CEM-C7 cells after 48 h-treatment by dexamethasone with or without 1.5 µM honokiol.
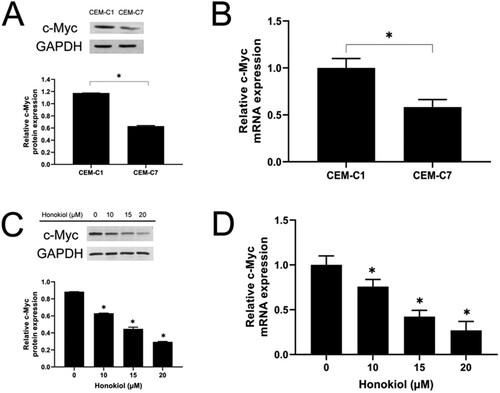
Figure 7. Effect of honokiol on c-Myc protein and mRNA expression levels in T-ALL cell lines. The expression level of c-Myc protein (A) and c-Myc mRNA (B) in DEX-resistant CEM-C1 cells and DEX – sensitive CEM-C7 cells. CEM-C1 cells were treated with honokiol at different concentrations (0–20 µM) for 48 h and the expression level of c-Myc protein (C) and c-Myc mRNA (D) were determined using western blot and RT-qPCR, respectively. Data represent mean ± SD (n = 3), *p < 0.05 as compared to the control group.
Supplementary material
Download TIFF Image (230.5 KB)Data availability statement
The datasets used and/or analyzed during the present study are available from the corresponding author on reasonable request.