
Figures & data
Table 1. Baseline of patients.
Figure 1. Summary of treatment response. (A) Minimal Residual Disease measured by flow cytometry. (B) Leukemia-associated fusion genes measured by real-time quantitative PCR.
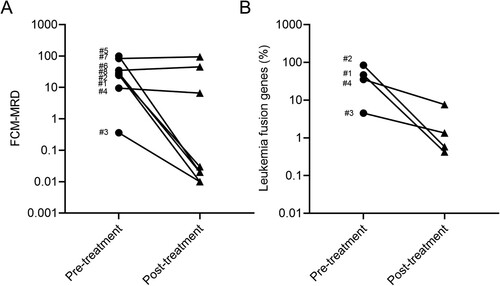
Table 2. Response rates for patients who received ven/aza.
Table 3. Treatment-emergent adverse events.
Data availability statement
The data that support the findings of this study are available from the corresponding author upon reasonable request.