Figures & data
Figure 1. Bath1 is highly expressed in newly diagnosed multiple myeloma (NDMM) patients in comparison to iron deficiency anemia (IDA) patients. (a) Representative image of immunohistochemical staining on Bach1 protein levels in bone marrow samples from IDA (n = 8) and NDMM patients (n = 29) (Scale bar = 100 μm). (b) Mean density (= Total density of slices / Total number of slices) of Bach1 protein of IDA and NDMM patients (p < 0.05).
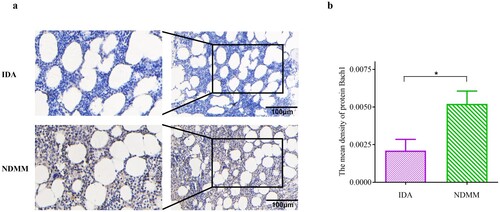
Table 1. Clinical characteristics of patients with NDMM and IDA.
Figure 2. Correlation analysis of Bach1 expression level with most possibly related variables (n = 29). (a) Correlation of Bach1 with most possibly related variables (n = 29). (b) C-reactive protein (CRP) were positively correlated with Bach1 expression level (p < 0.05). (c) Spearmen correlation analysis showed that CRP were indeed positively correlated with Bach1 expression level (p < 0.01). (d) In the Bach1 high-expression group, lactate dehydrogenase (LDH) and CKS1B were negatively correlated with the Bach1 expression level (p < 0.05). (e) Spearmen correlation analysis showed that CKS1B were indeed negatively correlated with Bach1 expression level (p < 0.01) in high-expression group. (f) Composition of CKS1B had no significant correlation with Bach1expression level in the entire group. (g) In the Bach1 low-expression group, Ki-67 and Age were negatively correlated with the Bach1 expression level (p < 0.05). (h) Spearmen correlation analysis showed that Ki-67 were indeed negatively correlated with Bach1 expression level (p < 0.01) in low-expression group. (i) Ki-67 had no significant correlation with Bach1expression level in the entire group.
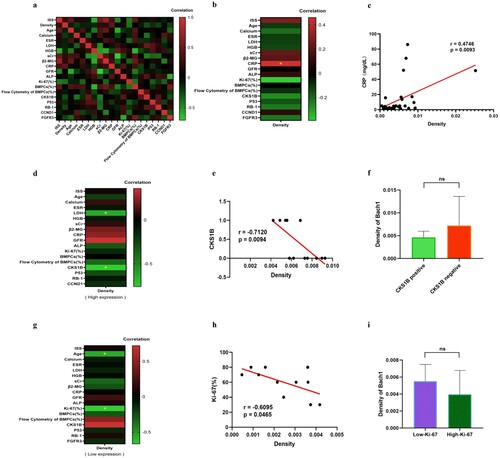
Table 2. Comparison of clinical features in NDMM patients with high/low Bach1 expression.
Figure 3. Correlation analysis of Bach1 expression levels with gender and ISS (n = 29).
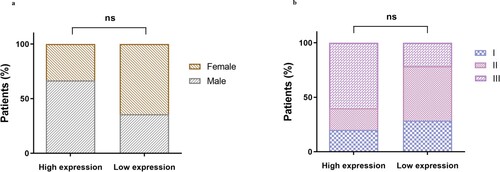
Figure 4. Relationship between Bach1 expression, survival, and the efficacy of Btz treatment. (a). Survival curve of NDMM patients in the high-expression and low-expression Bach1 groups (n = 29, p = 0.695). (b). The therapeutic efficacy of Btz in 16 patients with varying levels of Bach1 (n = 16, p < 0.05).
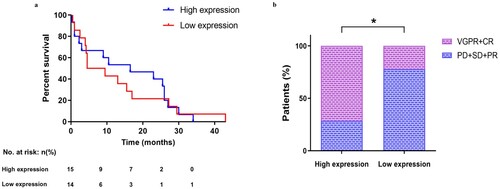
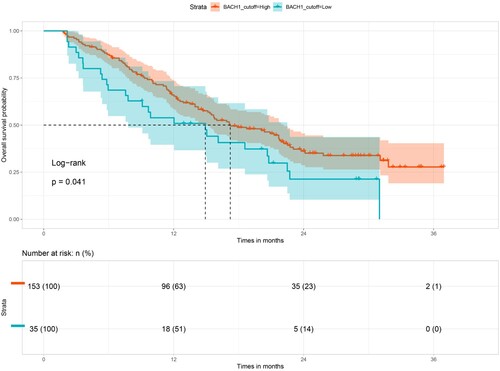
Figure 5. Survival curve of Btz-treatment patients with high and low Bach1 expression level.