
Figures & data
Table 1. General clinical data of HC patients.
Figure 1. Treatment of HC.
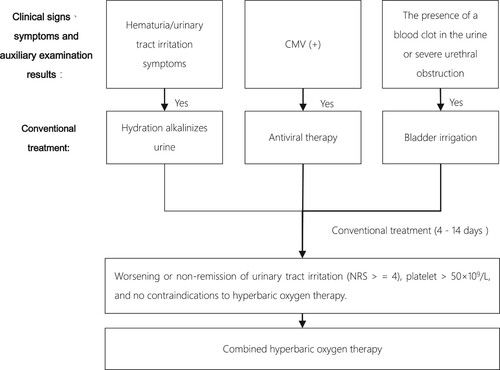
Table 2. Comparison of Patient characteristic data before HBOT in two groups.
Figure 2. Time after occurrence of HC (day) P = 0.0175 < 0.05.
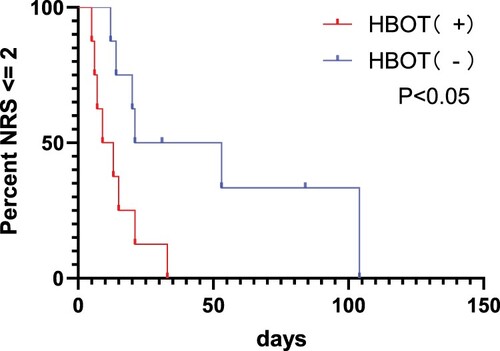
Table 3. The treatment time of the two groups.
Figure 3. There was no statistically significant difference in the analysis of the 2-year survival rates between the two transplantation groups. P = 0.0851 > 0.05.
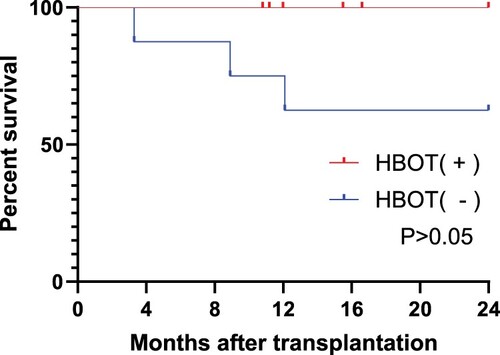
Table 4. Type of viruses.