Figures & data
Figure 1. Abnormal levels of TBA, TBiL, and DBiL in newborns with hemolytic disease. A. Levels of TBA in the serum of newborns in each group. B. Levels of TBiL measured in biochemical analysis. C. Levels of DBiL in the serum of newborns in each group. * indicates a significant difference compared to the Healthy group, P < 0.05. # indicates a significant difference compared to the HDN group, P < 0.05.
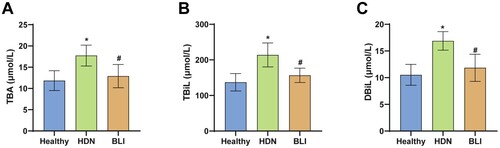
Figure 2. Abnormal levels of IgG subtypes in HDN. A. ELISA was used to measure the levels of IgG1 in the serum of newborns in each group. B. ELISA was used to measure the levels of IgG2a in the serum of newborns in each group. C. Levels of IgG2b in each group. D. Levels of IgG3 in the serum of newborns in the Healthy, HDN, and BLI groups. E. Levels of IgG4 in the serum of newborns in the three groups. * indicates a significant difference compared to the Healthy group, with statistical significance set at P < 0.05. # indicates a significant difference compared to the HDN group, with statistical significance set at P < 0.05.
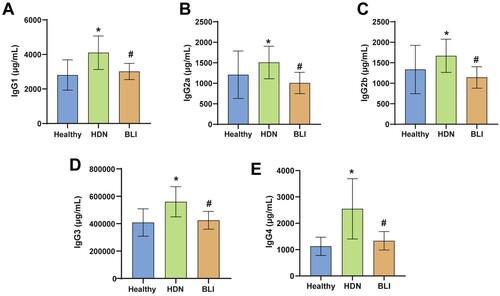
Figure 3. Abnormal levels of metabolites in HDN. A. PCA showing the differences in metabolites among the Healthy, HDN, and BLI groups. B. The top 71 different metabolites among the Healthy, HDN, and BLI groups.
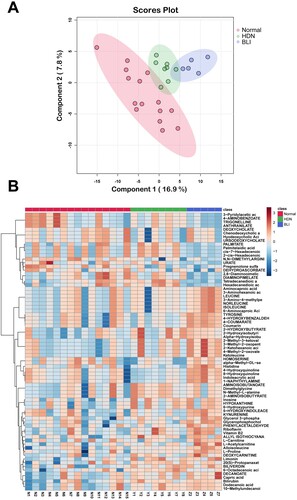
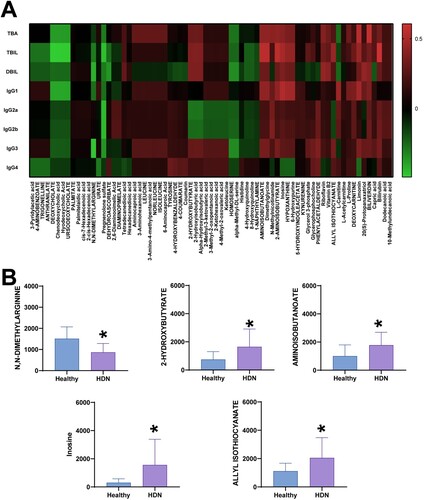
Figure 4. Correlation between HDN and metabolites. A. Correlation heatmap. B. Levels of metabolites in the two groups. * indicates a significant difference compared to the Healthy group, P < 0.05.