
Figures & data
Table 1. List of primers and probes used for detection of α-thalassemia SEA deletion and wild-type fragment.
Figure 1. The construction of microfluidic chip. The appearance of the microfluidic chip (2A). The feature of microfluidic chip with four identical networks (2B). The appearance of the pressure-permeable connecting caps (2C). The pressure-permeable connecting caps placed onto the inlet ports (2D).
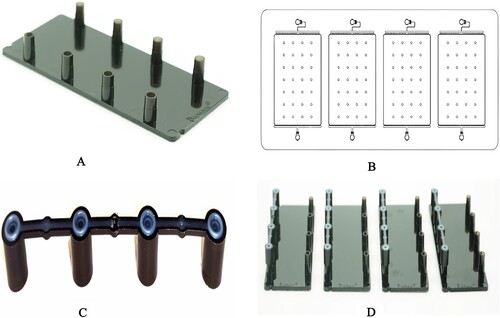
Figure 2. The difference in fluorescence amplitudes of α-thalassemia SEA deletion trait(A1-A5), Hb Bart's hydrops fetalis (B1-B5), and normal individual (C1-C5). Fluorescence of FAM and HEX channels indicated the presence of wild-type a-globin gene allele and α-thalassemia SEA deletion allele, respectively. Threshold lines are automatically interpreted by software.
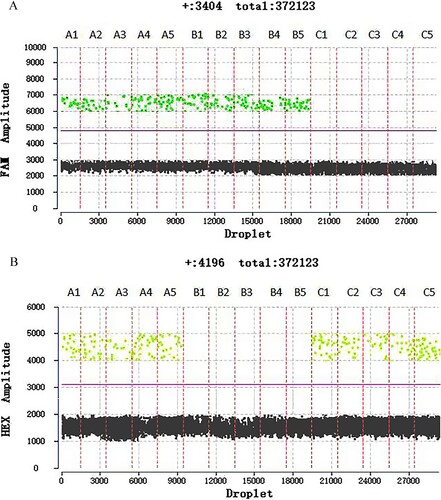
Figure 3. The ratio of DNA copy number of the α-thalassemia SEA deletion heterozygotes (Group A), compound heterozygosity for SEA deletion and other mutations (Group B), normal individuals (Group C), and Hb Bart's hydrops fetalis (Group D).
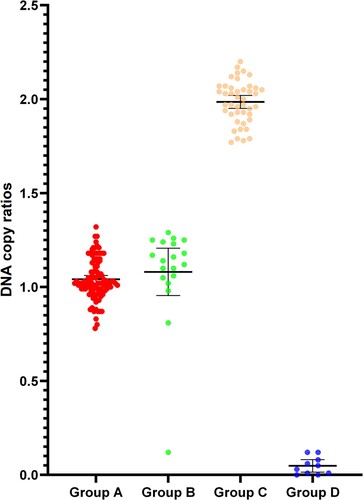
Figure 4. Linear study shows a positive linear correlation between the detected and the expected concentration. R2 = 0.9999 for α-thalassemia SEA deletion allele and R2 = 1 for the wild-type allele.
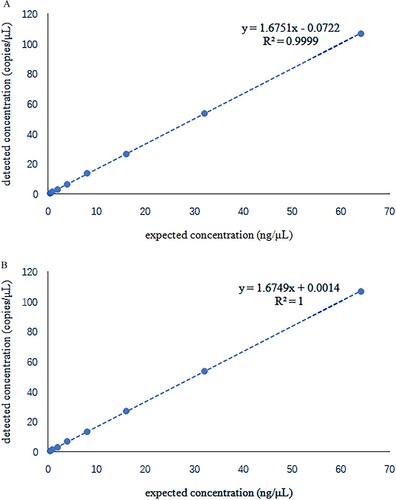
Figure 5. A total of 20 repeated experiments were performed for a repeatability study on template DNA concentration 2 ng/μL(4A) and 10 ng/μL(4B). The positive copy numbers of FAM and HEX channels were counted, respectively. Coefficients of variation were calculated based on positive copy numbers. The coefficient of variation is equal to the standard deviation divided by the mean. The coefficient of variation of the FAM channel (α-thalassemia SEA deletion allele) was 5.42%and 1.91% at 2 and 10 ng/μL template concentrations. In the HEX channel (wild-type allele) was 4.06% and 1.83% at 2 and 10 ng/μL template concentrations, respectively.
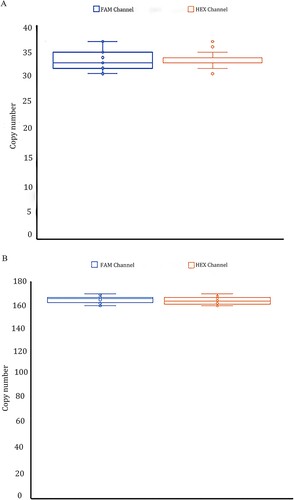
Table 2. Limit of detection study result. No positive droplet was detected in any fluorescence channel in twenty repeats of blank control. When the template DNA concentration was 0.1 ng/μL, one of the twenty repetitions was not detected, and the detection rate was 95%. The detection rate of all repetitions was 100% when the template DNA concentration was greater than or equal to 0.2 ng/μL.
Table 3. Genotypes, sample types, number of cases and copy number ratios in the samples of this study. Copy number ratio intergroup tests were significantly different except for no difference between SEA heterozygotes and Compround heterozygosity for SEA deletion and other mutations (P = 0.9848).